
 Yahoo Finance
 Should Bittium Oyj (HEL:BITTI) Focus On Improving This Fundamental Metric?

One of the best investments we can make is in our own knowledge and skill set. With that in mind, this article will work through how we can use Return On Equity (ROE) to better understand a business. We'll use ROE to examine Bittium Oyj (HEL:BITTI), by way of a worked example.
Bittium Oyj has a ROE of 3.7%, based on the last twelve months. One way to conceptualize this, is that for each €1 of shareholders' equity it has, the company made €0.037 in profit.
See our latest analysis for Bittium Oyj
How Do You Calculate Return On Equity?
The formula for return on equity is:
Return on Equity = Net Profit ÷ Shareholders' Equity
Or for Bittium Oyj:
3.7% = €4.0m ÷ €110m (Based on the trailing twelve months to December 2018.)
Most readers would understand what net profit is, but it’s worth explaining the concept of shareholders’ equity. It is all earnings retained by the company, plus any capital paid in by shareholders. You can calculate shareholders' equity by subtracting the company's total liabilities from its total assets.
What Does Return On Equity Signify?
ROE measures a company's profitability against the profit it retains, and any outside investments. The 'return' is the amount earned after tax over the last twelve months. A higher profit will lead to a higher ROE. So, all else being equal, a high ROE is better than a low one. That means it can be interesting to compare the ROE of different companies.
Does Bittium Oyj Have A Good ROE?
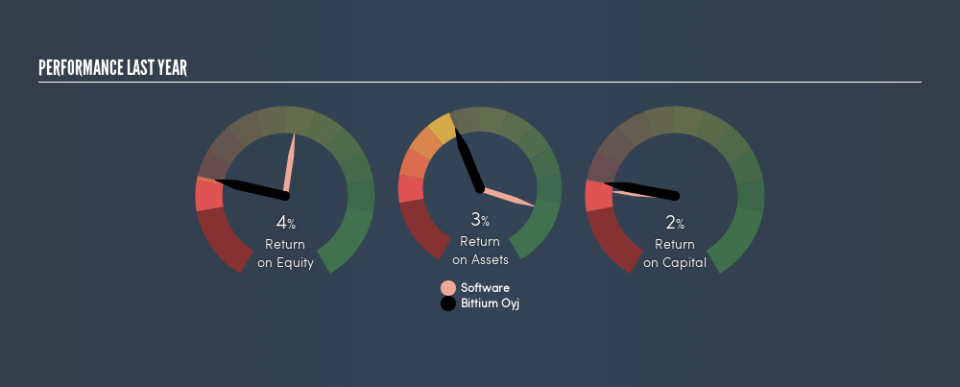
By comparing a company's ROE with its industry average, we can get a quick measure of how good it is. The limitation of this approach is that some companies are quite different from others, even within the same industry classification. As is clear from the image below, Bittium Oyj has a lower ROE than the average (17%) in the Software industry.
Unfortunately, that's sub-optimal. It is better when the ROE is above industry average, but a low one doesn't necessarily mean the business is overpriced. Nonetheless, it might be wise to check if insiders have been selling.
How Does Debt Impact ROE?
Most companies need money -- from somewhere -- to grow their profits. The cash for investment can come from prior year profits (retained earnings), issuing new shares, or borrowing. In the first two cases, the ROE will capture this use of capital to grow. In the latter case, the debt used for growth will improve returns, but won't affect the total equity. In this manner the use of debt will boost ROE, even though the core economics of the business stay the same.
Bittium Oyj's Debt And Its 3.7% ROE
Bittium Oyj has a debt to equity ratio of just 0.014, which is very low. I'm not impressed with its ROE, but the debt levels are not too high, indicating the business has decent prospects. Judicious use of debt to improve returns can certainly be a good thing, although it does elevate risk slightly and reduce future optionality.
The Bottom Line On ROE
Return on equity is useful for comparing the quality of different businesses. A company that can achieve a high return on equity without debt could be considered a high quality business. If two companies have around the same level of debt to equity, and one has a higher ROE, I'd generally prefer the one with higher ROE.
But ROE is just one piece of a bigger puzzle, since high quality businesses often trade on high multiples of earnings. The rate at which profits are likely to grow, relative to the expectations of profit growth reflected in the current price, must be considered, too. So you might want to check this FREE visualization of analyst forecasts for the company.
Of course, you might find a fantastic investment by looking elsewhere. So take a peek at this free list of interesting companies.
We aim to bring you long-term focused research analysis driven by fundamental data. Note that our analysis may not factor in the latest price-sensitive company announcements or qualitative material.
If you spot an error that warrants correction, please contact the editor at editorial-team@simplywallst.com. This article by Simply Wall St is general in nature. It does not constitute a recommendation to buy or sell any stock, and does not take account of your objectives, or your financial situation. Simply Wall St has no position in the stocks mentioned. Thank you for reading.
