
 Yahoo Finance
 BlackLine, Inc.'s (NASDAQ:BL) Business Is Trailing The Industry But Its Shares Aren't
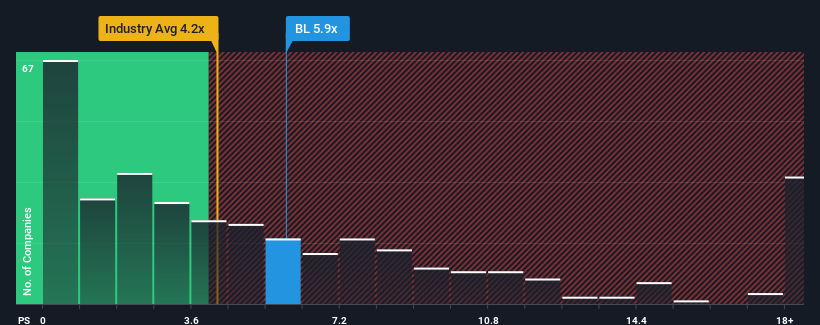
BlackLine, Inc.'s (NASDAQ:BL) price-to-sales (or "P/S") ratio of 5.9x might make it look like a sell right now compared to the Software industry in the United States, where around half of the companies have P/S ratios below 4.2x and even P/S below 1.8x are quite common. Although, it's not wise to just take the P/S at face value as there may be an explanation why it's as high as it is.
View our latest analysis for BlackLine
What Does BlackLine's Recent Performance Look Like?
With revenue growth that's superior to most other companies of late, BlackLine has been doing relatively well. It seems that many are expecting the strong revenue performance to persist, which has raised the P/S. If not, then existing shareholders might be a little nervous about the viability of the share price.
Keen to find out how analysts think BlackLine's future stacks up against the industry? In that case, our free report is a great place to start.
Do Revenue Forecasts Match The High P/S Ratio?
BlackLine's P/S ratio would be typical for a company that's expected to deliver solid growth, and importantly, perform better than the industry.
Taking a look back first, we see that the company grew revenue by an impressive 23% last year. Pleasingly, revenue has also lifted 81% in aggregate from three years ago, thanks to the last 12 months of growth. So we can start by confirming that the company has done a great job of growing revenue over that time.
Shifting to the future, estimates from the analysts covering the company suggest revenue should grow by 15% per year over the next three years. That's shaping up to be similar to the 13% per year growth forecast for the broader industry.
In light of this, it's curious that BlackLine's P/S sits above the majority of other companies. Apparently many investors in the company are more bullish than analysts indicate and aren't willing to let go of their stock right now. Although, additional gains will be difficult to achieve as this level of revenue growth is likely to weigh down the share price eventually.
The Bottom Line On BlackLine's P/S
While the price-to-sales ratio shouldn't be the defining factor in whether you buy a stock or not, it's quite a capable barometer of revenue expectations.
Seeing as its revenues are forecast to grow in line with the wider industry, it would appear that BlackLine currently trades on a higher than expected P/S. Right now we are uncomfortable with the relatively high share price as the predicted future revenues aren't likely to support such positive sentiment for long. Unless the company can jump ahead of the rest of the industry in the short-term, it'll be a challenge to maintain the share price at current levels.
It is also worth noting that we have found 2 warning signs for BlackLine that you need to take into consideration.
If these risks are making you reconsider your opinion on BlackLine, explore our interactive list of high quality stocks to get an idea of what else is out there.
Have feedback on this article? Concerned about the content? Get in touch with us directly. Alternatively, email editorial-team (at) simplywallst.com.
This article by Simply Wall St is general in nature. We provide commentary based on historical data and analyst forecasts only using an unbiased methodology and our articles are not intended to be financial advice. It does not constitute a recommendation to buy or sell any stock, and does not take account of your objectives, or your financial situation. We aim to bring you long-term focused analysis driven by fundamental data. Note that our analysis may not factor in the latest price-sensitive company announcements or qualitative material. Simply Wall St has no position in any stocks mentioned.
Join A Paid User Research Session
You’ll receive a US$30 Amazon Gift card for 1 hour of your time while helping us build better investing tools for the individual investors like yourself. Sign up here
