
 Yahoo Finance
 BluMetric Environmental (CVE:BLM) Is Reinvesting At Lower Rates Of Return
Finding a business that has the potential to grow substantially is not easy, but it is possible if we look at a few key financial metrics. Firstly, we'll want to see a proven return on capital employed (ROCE) that is increasing, and secondly, an expanding base of capital employed. This shows us that it's a compounding machine, able to continually reinvest its earnings back into the business and generate higher returns. However, after briefly looking over the numbers, we don't think BluMetric Environmental (CVE:BLM) has the makings of a multi-bagger going forward, but let's have a look at why that may be.
Return On Capital Employed (ROCE): What Is It?
If you haven't worked with ROCE before, it measures the 'return' (pre-tax profit) a company generates from capital employed in its business. Analysts use this formula to calculate it for BluMetric Environmental:
Return on Capital Employed = Earnings Before Interest and Tax (EBIT) ÷ (Total Assets - Current Liabilities)
0.11 = CA$1.5m ÷ (CA$19m - CA$4.9m) (Based on the trailing twelve months to March 2023).
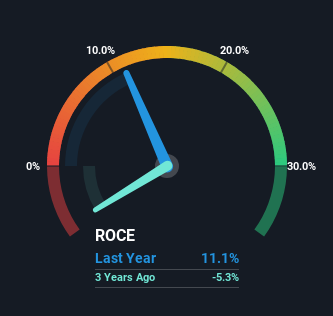
Thus, BluMetric Environmental has an ROCE of 11%. On its own, that's a standard return, however it's much better than the 8.1% generated by the Commercial Services industry.
See our latest analysis for BluMetric Environmental
While the past is not representative of the future, it can be helpful to know how a company has performed historically, which is why we have this chart above. If you want to delve into the historical earnings, revenue and cash flow of BluMetric Environmental, check out these free graphs here.
What Can We Tell From BluMetric Environmental's ROCE Trend?
On the surface, the trend of ROCE at BluMetric Environmental doesn't inspire confidence. Around five years ago the returns on capital were 29%, but since then they've fallen to 11%. Meanwhile, the business is utilizing more capital but this hasn't moved the needle much in terms of sales in the past 12 months, so this could reflect longer term investments. It's worth keeping an eye on the company's earnings from here on to see if these investments do end up contributing to the bottom line.
On a related note, BluMetric Environmental has decreased its current liabilities to 26% of total assets. So we could link some of this to the decrease in ROCE. What's more, this can reduce some aspects of risk to the business because now the company's suppliers or short-term creditors are funding less of its operations. Since the business is basically funding more of its operations with it's own money, you could argue this has made the business less efficient at generating ROCE.
In Conclusion...
In summary, BluMetric Environmental is reinvesting funds back into the business for growth but unfortunately it looks like sales haven't increased much just yet. Although the market must be expecting these trends to improve because the stock has gained 88% over the last five years. Ultimately, if the underlying trends persist, we wouldn't hold our breath on it being a multi-bagger going forward.
One more thing: We've identified 2 warning signs with BluMetric Environmental (at least 1 which is significant) , and understanding these would certainly be useful.
If you want to search for solid companies with great earnings, check out this free list of companies with good balance sheets and impressive returns on equity.
Have feedback on this article? Concerned about the content? Get in touch with us directly. Alternatively, email editorial-team (at) simplywallst.com.
This article by Simply Wall St is general in nature. We provide commentary based on historical data and analyst forecasts only using an unbiased methodology and our articles are not intended to be financial advice. It does not constitute a recommendation to buy or sell any stock, and does not take account of your objectives, or your financial situation. We aim to bring you long-term focused analysis driven by fundamental data. Note that our analysis may not factor in the latest price-sensitive company announcements or qualitative material. Simply Wall St has no position in any stocks mentioned.
