
 Yahoo Finance
 Boasting A 31% Return On Equity, Is Adyen N.V. (AMS:ADYEN) A Top Quality Stock?

While some investors are already well versed in financial metrics (hat tip), this article is for those who would like to learn about Return On Equity (ROE) and why it is important. We'll use ROE to examine Adyen N.V. (AMS:ADYEN), by way of a worked example.
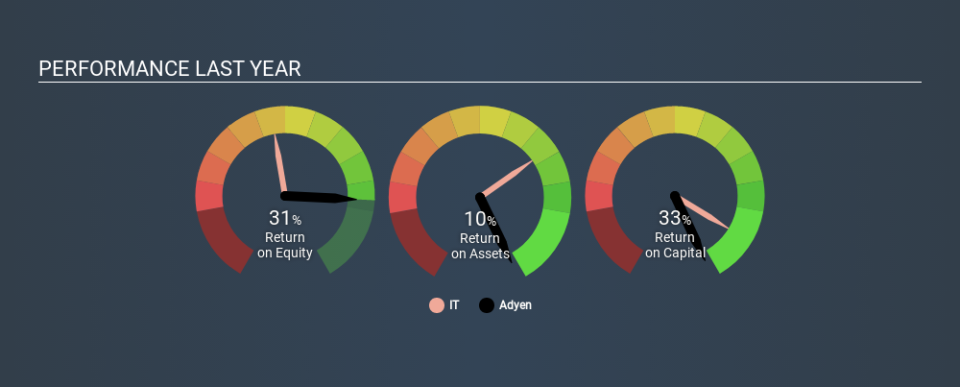
Adyen has a ROE of 31%, based on the last twelve months. Another way to think of that is that for every €1 worth of equity in the company, it was able to earn €0.31.
View our latest analysis for Adyen
How Do I Calculate ROE?
The formula for ROE is:
Return on Equity = Net Profit (from continuing operations) ÷ Shareholders' Equity
Or for Adyen:
31% = €204m ÷ €661m (Based on the trailing twelve months to December 2019.)
It's easy to understand the 'net profit' part of that equation, but 'shareholders' equity' requires further explanation. It is all earnings retained by the company, plus any capital paid in by shareholders. You can calculate shareholders' equity by subtracting the company's total liabilities from its total assets.
What Does Return On Equity Signify?
ROE measures a company's profitability against the profit it retains, and any outside investments. The 'return' is the yearly profit. A higher profit will lead to a higher ROE. So, all else equal, investors should like a high ROE. Clearly, then, one can use ROE to compare different companies.
Does Adyen Have A Good Return On Equity?
One simple way to determine if a company has a good return on equity is to compare it to the average for its industry. Importantly, this is far from a perfect measure, because companies differ significantly within the same industry classification. Pleasingly, Adyen has a superior ROE than the average (14%) company in the IT industry.
That's what I like to see. In my book, a high ROE almost always warrants a closer look. For example you might check if insiders are buying shares.
Why You Should Consider Debt When Looking At ROE
Companies usually need to invest money to grow their profits. The cash for investment can come from prior year profits (retained earnings), issuing new shares, or borrowing. In the case of the first and second options, the ROE will reflect this use of cash, for growth. In the latter case, the debt used for growth will improve returns, but won't affect the total equity. In this manner the use of debt will boost ROE, even though the core economics of the business stay the same.
Adyen's Debt And Its 31% ROE
One positive for shareholders is that Adyen does not have any net debt! Its high ROE already points to a high quality business, but the lack of debt is a cherry on top. After all, when a company has a strong balance sheet, it can often find ways to invest in growth, even if it takes some time.
The Bottom Line On ROE
Return on equity is useful for comparing the quality of different businesses. A company that can achieve a high return on equity without debt could be considered a high quality business. If two companies have around the same level of debt to equity, and one has a higher ROE, I'd generally prefer the one with higher ROE.
But when a business is high quality, the market often bids it up to a price that reflects this. It is important to consider other factors, such as future profit growth -- and how much investment is required going forward. So you might want to take a peek at this data-rich interactive graph of forecasts for the company.
Of course, you might find a fantastic investment by looking elsewhere. So take a peek at this free list of interesting companies.
If you spot an error that warrants correction, please contact the editor at editorial-team@simplywallst.com. This article by Simply Wall St is general in nature. It does not constitute a recommendation to buy or sell any stock, and does not take account of your objectives, or your financial situation. Simply Wall St has no position in the stocks mentioned.
We aim to bring you long-term focused research analysis driven by fundamental data. Note that our analysis may not factor in the latest price-sensitive company announcements or qualitative material. Thank you for reading.
