
 Yahoo Finance
 Boku, Inc.'s (LON:BOKU) Share Price Could Signal Some Risk
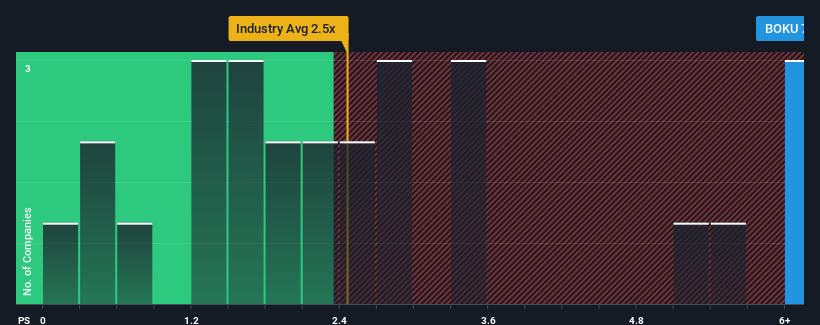
Boku, Inc.'s (LON:BOKU) price-to-sales (or "P/S") ratio of 7.3x may look like a poor investment opportunity when you consider close to half the companies in the Diversified Financial industry in the United Kingdom have P/S ratios below 2.5x. Although, it's not wise to just take the P/S at face value as there may be an explanation why it's so lofty.
View our latest analysis for Boku
How Boku Has Been Performing
Boku certainly has been doing a good job lately as its revenue growth has been positive while most other companies have been seeing their revenue go backwards. The P/S ratio is probably high because investors think the company will continue to navigate the broader industry headwinds better than most. If not, then existing shareholders might be a little nervous about the viability of the share price.
If you'd like to see what analysts are forecasting going forward, you should check out our free report on Boku.
How Is Boku's Revenue Growth Trending?
The only time you'd be truly comfortable seeing a P/S as steep as Boku's is when the company's growth is on track to outshine the industry decidedly.
Taking a look back first, we see that the company grew revenue by an impressive 16% last year. The strong recent performance means it was also able to grow revenue by 40% in total over the last three years. So we can start by confirming that the company has done a great job of growing revenue over that time.
Turning to the outlook, the next three years should generate growth of 15% each year as estimated by the seven analysts watching the company. That's shaping up to be similar to the 14% per annum growth forecast for the broader industry.
With this in consideration, we find it intriguing that Boku's P/S is higher than its industry peers. It seems most investors are ignoring the fairly average growth expectations and are willing to pay up for exposure to the stock. Although, additional gains will be difficult to achieve as this level of revenue growth is likely to weigh down the share price eventually.
The Final Word
While the price-to-sales ratio shouldn't be the defining factor in whether you buy a stock or not, it's quite a capable barometer of revenue expectations.
Seeing as its revenues are forecast to grow in line with the wider industry, it would appear that Boku currently trades on a higher than expected P/S. When we see revenue growth that just matches the industry, we don't expect elevates P/S figures to remain inflated for the long-term. A positive change is needed in order to justify the current price-to-sales ratio.
Having said that, be aware Boku is showing 2 warning signs in our investment analysis, you should know about.
If companies with solid past earnings growth is up your alley, you may wish to see this free collection of other companies with strong earnings growth and low P/E ratios.
Have feedback on this article? Concerned about the content? Get in touch with us directly. Alternatively, email editorial-team (at) simplywallst.com.
This article by Simply Wall St is general in nature. We provide commentary based on historical data and analyst forecasts only using an unbiased methodology and our articles are not intended to be financial advice. It does not constitute a recommendation to buy or sell any stock, and does not take account of your objectives, or your financial situation. We aim to bring you long-term focused analysis driven by fundamental data. Note that our analysis may not factor in the latest price-sensitive company announcements or qualitative material. Simply Wall St has no position in any stocks mentioned.
