
 Yahoo Finance
 Will boohoo group (LON:BOO) Repeat Its Return Growth Of The Past?
What trends should we look for it we want to identify stocks that can multiply in value over the long term? One common approach is to try and find a company with returns on capital employed (ROCE) that are increasing, in conjunction with a growing amount of capital employed. This shows us that it's a compounding machine, able to continually reinvest its earnings back into the business and generate higher returns. And in light of that, the trends we're seeing at boohoo group's (LON:BOO) look very promising so lets take a look.
What is Return On Capital Employed (ROCE)?
Just to clarify if you're unsure, ROCE is a metric for evaluating how much pre-tax income (in percentage terms) a company earns on the capital invested in its business. To calculate this metric for boohoo group, this is the formula:
Return on Capital Employed = Earnings Before Interest and Tax (EBIT) ÷ (Total Assets - Current Liabilities)
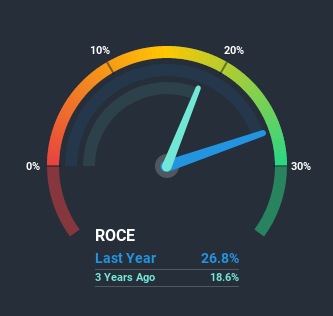
0.27 = UK£114m ÷ (UK£759m - UK£334m) (Based on the trailing twelve months to August 2020).
So, boohoo group has an ROCE of 27%. In absolute terms that's a great return and it's even better than the Online Retail industry average of 15%.
Check out our latest analysis for boohoo group
Above you can see how the current ROCE for boohoo group compares to its prior returns on capital, but there's only so much you can tell from the past. If you'd like, you can check out the forecasts from the analysts covering boohoo group here for free.
What Can We Tell From boohoo group's ROCE Trend?
We like the trends that we're seeing from boohoo group. Over the last five years, returns on capital employed have risen substantially to 27%. Basically the business is earning more per dollar of capital invested and in addition to that, 490% more capital is being employed now too. So we're very much inspired by what we're seeing at boohoo group thanks to its ability to profitably reinvest capital.
On a side note, we noticed that the improvement in ROCE appears to be partly fueled by an increase in current liabilities. Effectively this means that suppliers or short-term creditors are now funding 44% of the business, which is more than it was five years ago. Given it's pretty high ratio, we'd remind investors that having current liabilities at those levels can bring about some risks in certain businesses.
In Conclusion...
All in all, it's terrific to see that boohoo group is reaping the rewards from prior investments and is growing its capital base. Since the stock has returned a staggering 794% to shareholders over the last five years, it looks like investors are recognizing these changes. With that being said, we still think the promising fundamentals mean the company deserves some further due diligence.
Like most companies, boohoo group does come with some risks, and we've found 1 warning sign that you should be aware of.
If you'd like to see other companies earning high returns, check out our free list of companies earning high returns with solid balance sheets here.
This article by Simply Wall St is general in nature. It does not constitute a recommendation to buy or sell any stock, and does not take account of your objectives, or your financial situation. We aim to bring you long-term focused analysis driven by fundamental data. Note that our analysis may not factor in the latest price-sensitive company announcements or qualitative material. Simply Wall St has no position in any stocks mentioned.
Have feedback on this article? Concerned about the content? Get in touch with us directly. Alternatively, email editorial-team@simplywallst.com.
