
 Yahoo Finance
 boohoo group plc (LON:BOO) P/E Isn't Throwing Up Surprises

Want to participate in a short research study? Help shape the future of investing tools and earn a $40 gift card!
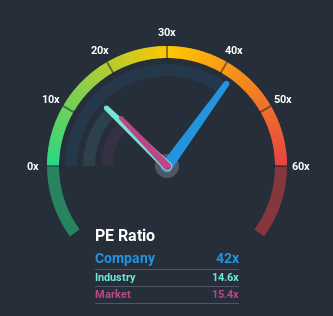
With a price-to-earnings (or "P/E") ratio of 42x boohoo group plc (LON:BOO) may be sending very bearish signals at the moment, given that almost half of all companies in the United Kingdom have P/E ratios under 15x and even P/E's lower than 8x are not unusual. However, the P/E might be quite high for a reason and it requires further investigation to determine if it's justified.
With earnings growth that's superior to most other companies of late, boohoo group has been doing relatively well. It seems that many are expecting the strong earnings performance to persist, which has raised the P/E. You'd really hope so, otherwise you're paying a pretty hefty price for no particular reason.
View our latest analysis for boohoo group
How Does boohoo group's P/E Ratio Compare To Its Industry Peers?
It's plausible that boohoo group's particularly high P/E ratio could be a result of tendencies within its own industry. It turns out the Online Retail industry in general has a P/E ratio similar to the market, as the graphic below shows. So unfortunately this doesn't provide a lot to explain the company's ratio right now. Some industry P/E's don't move around a lot and right now most companies within the Online Retail industry should be getting restrained. Nonetheless, the greatest force on the company's P/E will be its own earnings growth expectations.
Want the full picture on analyst estimates for the company? Then our free report on boohoo group will help you uncover what's on the horizon.
Does Growth Match The High P/E?
In order to justify its P/E ratio, boohoo group would need to produce outstanding growth well in excess of the market.
If we review the last year of earnings growth, the company posted a terrific increase of 45%. The latest three year period has also seen an excellent 151% overall rise in EPS, aided by its short-term performance. Therefore, it's fair to say the earnings growth recently has been superb for the company.
Shifting to the future, estimates from the analysts covering the company suggest earnings should grow by 30% each year over the next three years. That's shaping up to be materially higher than the 8.2% each year growth forecast for the broader market.
With this information, we can see why boohoo group is trading at such a high P/E compared to the market. It seems most investors are expecting this strong future growth and are willing to pay more for the stock.
The Key Takeaway
Generally, our preference is to limit the use of the price-to-earnings ratio to establishing what the market thinks about the overall health of a company.
We've established that boohoo group maintains its high P/E on the strength of its forecast growth being higher than the wider market, as expected. At this stage investors feel the potential for a deterioration in earnings isn't great enough to justify a lower P/E ratio. It's hard to see the share price falling strongly in the near future under these circumstances.
And what about other risks? Every company has them, and we've spotted 1 warning sign for boohoo group you should know about.
It's important to make sure you look for a great company, not just the first idea you come across. So take a peek at this free list of interesting companies with strong recent earnings growth (and a P/E ratio below 20x).
This article by Simply Wall St is general in nature. It does not constitute a recommendation to buy or sell any stock, and does not take account of your objectives, or your financial situation. We aim to bring you long-term focused analysis driven by fundamental data. Note that our analysis may not factor in the latest price-sensitive company announcements or qualitative material. Simply Wall St has no position in any stocks mentioned.
Have feedback on this article? Concerned about the content? Get in touch with us directly. Alternatively, email editorial-team@simplywallst.com.
