
 Yahoo Finance
 Boston Properties (BXP) Beats Q2 FFO Estimates, Ups '22 View

Boston Properties Inc.’s BXP second-quarter 2022 funds from operations (FFO) per share of $1.94 beat the Zacks Consensus Estimate of $1.85. The figure also compared favorably with the year-ago quarter’s $1.72.
BXP’s quarterly results reflect growth in the bottom line. Also, it experienced strong leasing activity during the quarter.
Quarterly revenues from lease came in at $721.9 million, marginally rising from $718.1 million in the year-ago quarter. Moreover, the figure surpassed the consensus mark of $718.0 million.
Quarter in Detail
Boston Properties’ rental revenues (excluding termination income) for the office portfolio came in at $710.6 million, growing 4.3 % year over year. The same for the hotel & residential segment aggregated $29 million, more than doubling year over year.
BXP’s share of same property net operating income (NOI) on a cash basis (excluding termination income) totaled $470.6 million, up 10.4% year over year.
Its share of EBITDAre, on a cash basis, grew 7.1% to $433.2 million sequentially.
BXP’s in-service properties occupancy grew sequentially from 89.1% to 89.5%.
Portfolio Activity
As of Jun 30, 2022, Boston Properties’ portfolio comprised 193 properties, encompassing 53.7 million square feet of space. This included 12 properties under construction/redevelopment.
During the second quarter, the company executed 1.9 million square feet of leases, marking the strongest leasing quarter since the third quarter of 2019.
It closed on the acquisition of Madison Centre in Seattle, WA, for a gross purchase price of roughly $730 million.
Moreover, BXP started two development projects within Reston Town Center in Reston, VA, during the quarter. In June 2022, it completed and fully placed in-service 325 Main Street located in Cambridge, MA. This is a Class A office building encompassing 414,000 square feet of office and retail space of which the office component, comprising nearly 380,000 square feet, is 100% leased.
Also, in June 2022, BXP disposed of a portfolio of 11 suburban office properties spanning 733,000 net rentable square feet, located in Springfield, VA, for a total gross sales price of $127 million. The transaction generated net cash proceeds of $ 121.9 million, with BXP realizing a nearly $96.2 million gain on the sale of real estate.
Liquidity
Boston Properties exited second-quarter 2022 with $456.5 million of cash and cash equivalents, up from $436.3 million as of Mar 31, 2022.
BXP’s share of net debt to EBITDAre annualized was 7.46 times as of Jun 30, 2022, down from 7.50 times as of Mar 31, 2022.
2022 Outlook
Boston Properties raised its 2022 outlook.
For the third quarter, the company projects FFO per share of $1.86-$1.88. The Zacks Consensus Estimate for the same is currently pegged at $1.89.
For 2022, it projects FFO per share in the range of $7.48-$7.53, up from $7.40-$7.50 guided earlier. The Zacks Consensus Estimate is currently pegged at $7.48.
Boston Properties currently carries a Zacks Rank #3 (Hold). You can see the complete list of today’s Zacks #1 Rank (Strong Buy) stocks here.
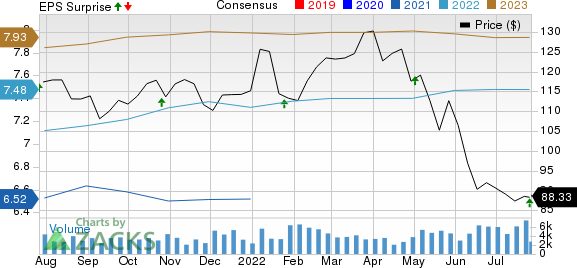
Boston Properties, Inc. Price, Consensus and EPS Surprise
Boston Properties, Inc. price-consensus-eps-surprise-chart | Boston Properties, Inc. Quote
Performance of Other REITs
SL Green Realty SLG reported second-quarter 2022 FFO per share of $1.87, beating the Zacks Consensus Estimate of $1.69. The reported FFO per share compared favorably with the year-ago quarter’s $1.60.
SLG's first-quarter performance was driven by year-over-year growth in the bottom line and healthy leasing activity.
Crown Castle International Corp.’s CCI second-quarter 2022 adjusted funds from operations (AFFO) per share were $1.80. The Zacks Consensus Estimate for the same was pegged at $1.79. Net revenues of $1.73 billion exceeded the Zacks Consensus Estimate of $1.71 billion.
Growth in site-rental revenues due to elevated tower space demand aided the top-line performance. CCI also raised the outlook for adjusted EBITDA for 2022.
Alexandria Real Estate Equities, Inc. ARE reported second-quarter 2022 adjusted FFO per share of $2.10, surpassing the Zacks Consensus Estimate of $2.06. The reported FFO per share also compared favorably with the year-ago quarter’s $1.93.
Alexandria witnessed continued healthy leasing activity and rental rate growth during the quarter.
Note: Anything related to earnings presented in this write-up represent funds from operations (FFO) — a widely used metric to gauge the performance of REITs.
Want the latest recommendations from Zacks Investment Research? Today, you can download 7 Best Stocks for the Next 30 Days. Click to get this free report
Boston Properties, Inc. (BXP) : Free Stock Analysis Report
Crown Castle International Corporation (CCI) : Free Stock Analysis Report
SL Green Realty Corporation (SLG) : Free Stock Analysis Report
Alexandria Real Estate Equities, Inc. (ARE) : Free Stock Analysis Report
To read this article on Zacks.com click here.
Zacks Investment Research
