
 Yahoo Finance
 Do You Like Brady Corporation (NYSE:BRC) At This P/E Ratio?

This article is written for those who want to get better at using price to earnings ratios (P/E ratios). We'll look at Brady Corporation's (NYSE:BRC) P/E ratio and reflect on what it tells us about the company's share price. Based on the last twelve months, Brady's P/E ratio is 18.29. In other words, at today's prices, investors are paying $18.29 for every $1 in prior year profit.
See our latest analysis for Brady
How Do You Calculate A P/E Ratio?
The formula for price to earnings is:
Price to Earnings Ratio = Price per Share ÷ Earnings per Share (EPS)
Or for Brady:
P/E of 18.29 = $48.830 ÷ $2.670 (Based on the trailing twelve months to January 2020.)
(Note: the above calculation results may not be precise due to rounding.)
Is A High P/E Ratio Good?
A higher P/E ratio means that buyers have to pay a higher price for each $1 the company has earned over the last year. That isn't necessarily good or bad, but a high P/E implies relatively high expectations of what a company can achieve in the future.
Does Brady Have A Relatively High Or Low P/E For Its Industry?
One good way to get a quick read on what market participants expect of a company is to look at its P/E ratio. We can see in the image below that the average P/E (26.8) for companies in the commercial services industry is higher than Brady's P/E.
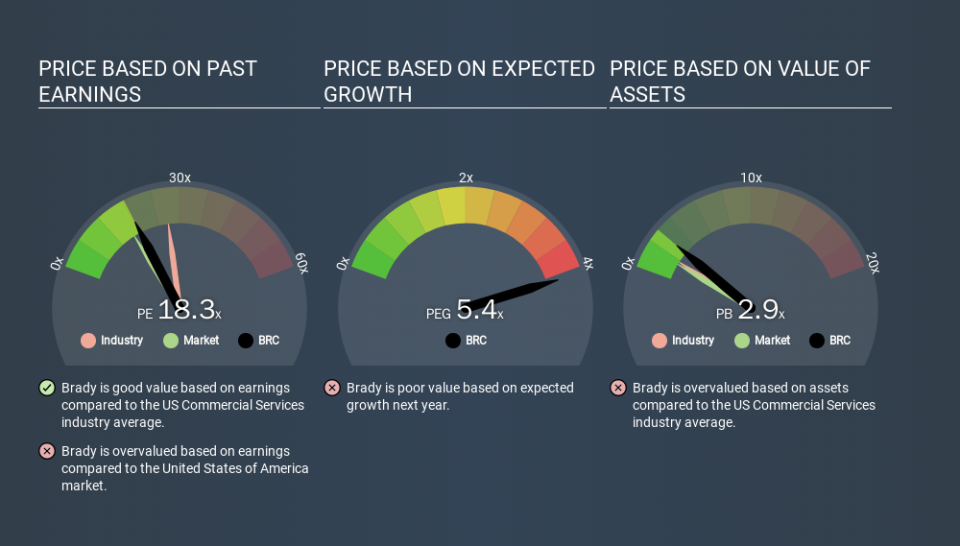
Its relatively low P/E ratio indicates that Brady shareholders think it will struggle to do as well as other companies in its industry classification. While current expectations are low, the stock could be undervalued if the situation is better than the market assumes. You should delve deeper. I like to check if company insiders have been buying or selling.
How Growth Rates Impact P/E Ratios
Earnings growth rates have a big influence on P/E ratios. When earnings grow, the 'E' increases, over time. That means unless the share price increases, the P/E will reduce in a few years. And as that P/E ratio drops, the company will look cheap, unless its share price increases.
It's great to see that Brady grew EPS by 16% in the last year. And it has improved its earnings per share by 13% per year over the last three years. So one might expect an above average P/E ratio.
Remember: P/E Ratios Don't Consider The Balance Sheet
The 'Price' in P/E reflects the market capitalization of the company. That means it doesn't take debt or cash into account. The exact same company would hypothetically deserve a higher P/E ratio if it had a strong balance sheet, than if it had a weak one with lots of debt, because a cashed up company can spend on growth.
While growth expenditure doesn't always pay off, the point is that it is a good option to have; but one that the P/E ratio ignores.
So What Does Brady's Balance Sheet Tell Us?
The extra options and safety that comes with Brady's US$240m net cash position means that it deserves a higher P/E than it would if it had a lot of net debt.
The Bottom Line On Brady's P/E Ratio
Brady's P/E is 18.3 which is above average (16.2) in its market. With cash in the bank the company has plenty of growth options -- and it is already on the right track. Therefore it seems reasonable that the market would have relatively high expectations of the company
Investors have an opportunity when market expectations about a stock are wrong. People often underestimate remarkable growth -- so investors can make money when fast growth is not fully appreciated. So this free visual report on analyst forecasts could hold the key to an excellent investment decision.
You might be able to find a better buy than Brady. If you want a selection of possible winners, check out this free list of interesting companies that trade on a P/E below 20 (but have proven they can grow earnings).
If you spot an error that warrants correction, please contact the editor at editorial-team@simplywallst.com. This article by Simply Wall St is general in nature. It does not constitute a recommendation to buy or sell any stock, and does not take account of your objectives, or your financial situation. Simply Wall St has no position in the stocks mentioned.
We aim to bring you long-term focused research analysis driven by fundamental data. Note that our analysis may not factor in the latest price-sensitive company announcements or qualitative material. Thank you for reading.
