
 Yahoo Finance
 Braime Group (LON:BMT) Knows How To Allocate Capital
If we want to find a potential multi-bagger, often there are underlying trends that can provide clues. Typically, we'll want to notice a trend of growing return on capital employed (ROCE) and alongside that, an expanding base of capital employed. If you see this, it typically means it's a company with a great business model and plenty of profitable reinvestment opportunities. So, when we ran our eye over Braime Group's (LON:BMT) trend of ROCE, we really liked what we saw.
What Is Return On Capital Employed (ROCE)?
Just to clarify if you're unsure, ROCE is a metric for evaluating how much pre-tax income (in percentage terms) a company earns on the capital invested in its business. The formula for this calculation on Braime Group is:
Return on Capital Employed = Earnings Before Interest and Tax (EBIT) ÷ (Total Assets - Current Liabilities)
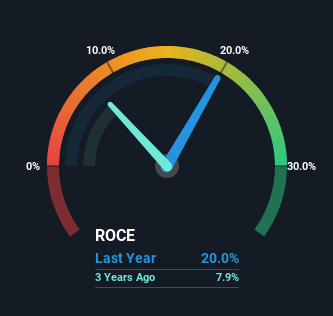
0.20 = UK£4.5m ÷ (UK£35m - UK£12m) (Based on the trailing twelve months to June 2023).
Therefore, Braime Group has an ROCE of 20%. That's a fantastic return and not only that, it outpaces the average of 15% earned by companies in a similar industry.
See our latest analysis for Braime Group
While the past is not representative of the future, it can be helpful to know how a company has performed historically, which is why we have this chart above. If you want to delve into the historical earnings, revenue and cash flow of Braime Group, check out these free graphs here.
The Trend Of ROCE
It's hard not to be impressed by Braime Group's returns on capital. The company has consistently earned 20% for the last five years, and the capital employed within the business has risen 89% in that time. Returns like this are the envy of most businesses and given it has repeatedly reinvested at these rates, that's even better. If Braime Group can keep this up, we'd be very optimistic about its future.
The Bottom Line On Braime Group's ROCE
In the end, the company has proven it can reinvest it's capital at high rates of returns, which you'll remember is a trait of a multi-bagger. However, despite the favorable fundamentals, the stock has fallen 30% over the last five years, so there might be an opportunity here for astute investors. For that reason, savvy investors might want to look further into this company in case it's a prime investment.
One more thing to note, we've identified 1 warning sign with Braime Group and understanding this should be part of your investment process.
If you want to search for more stocks that have been earning high returns, check out this free list of stocks with solid balance sheets that are also earning high returns on equity.
Have feedback on this article? Concerned about the content? Get in touch with us directly. Alternatively, email editorial-team (at) simplywallst.com.
This article by Simply Wall St is general in nature. We provide commentary based on historical data and analyst forecasts only using an unbiased methodology and our articles are not intended to be financial advice. It does not constitute a recommendation to buy or sell any stock, and does not take account of your objectives, or your financial situation. We aim to bring you long-term focused analysis driven by fundamental data. Note that our analysis may not factor in the latest price-sensitive company announcements or qualitative material. Simply Wall St has no position in any stocks mentioned.
