
 Yahoo Finance
 Brighton Pier Group (LON:PIER) Could Be Struggling To Allocate Capital
Finding a business that has the potential to grow substantially is not easy, but it is possible if we look at a few key financial metrics. Amongst other things, we'll want to see two things; firstly, a growing return on capital employed (ROCE) and secondly, an expansion in the company's amount of capital employed. Put simply, these types of businesses are compounding machines, meaning they are continually reinvesting their earnings at ever-higher rates of return. However, after investigating Brighton Pier Group (LON:PIER), we don't think it's current trends fit the mold of a multi-bagger.
Understanding Return On Capital Employed (ROCE)
Just to clarify if you're unsure, ROCE is a metric for evaluating how much pre-tax income (in percentage terms) a company earns on the capital invested in its business. The formula for this calculation on Brighton Pier Group is:
Return on Capital Employed = Earnings Before Interest and Tax (EBIT) ÷ (Total Assets - Current Liabilities)
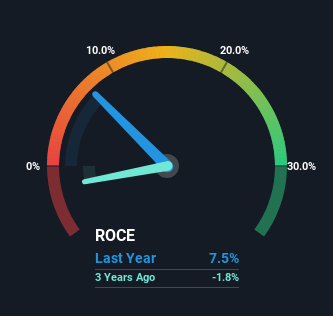
0.075 = UK£4.3m ÷ (UK£70m - UK£12m) (Based on the trailing twelve months to June 2023).
So, Brighton Pier Group has an ROCE of 7.5%. On its own, that's a low figure but it's around the 6.5% average generated by the Hospitality industry.
See our latest analysis for Brighton Pier Group
Above you can see how the current ROCE for Brighton Pier Group compares to its prior returns on capital, but there's only so much you can tell from the past. If you're interested, you can view the analysts predictions in our free report on analyst forecasts for the company.
How Are Returns Trending?
On the surface, the trend of ROCE at Brighton Pier Group doesn't inspire confidence. To be more specific, ROCE has fallen from 9.9% over the last five years. Meanwhile, the business is utilizing more capital but this hasn't moved the needle much in terms of sales in the past 12 months, so this could reflect longer term investments. It may take some time before the company starts to see any change in earnings from these investments.
What We Can Learn From Brighton Pier Group's ROCE
To conclude, we've found that Brighton Pier Group is reinvesting in the business, but returns have been falling. Since the stock has declined 53% over the last five years, investors may not be too optimistic on this trend improving either. In any case, the stock doesn't have these traits of a multi-bagger discussed above, so if that's what you're looking for, we think you'd have more luck elsewhere.
If you'd like to know about the risks facing Brighton Pier Group, we've discovered 3 warning signs that you should be aware of.
While Brighton Pier Group may not currently earn the highest returns, we've compiled a list of companies that currently earn more than 25% return on equity. Check out this free list here.
Have feedback on this article? Concerned about the content? Get in touch with us directly. Alternatively, email editorial-team (at) simplywallst.com.
This article by Simply Wall St is general in nature. We provide commentary based on historical data and analyst forecasts only using an unbiased methodology and our articles are not intended to be financial advice. It does not constitute a recommendation to buy or sell any stock, and does not take account of your objectives, or your financial situation. We aim to bring you long-term focused analysis driven by fundamental data. Note that our analysis may not factor in the latest price-sensitive company announcements or qualitative material. Simply Wall St has no position in any stocks mentioned.
