
 Yahoo Finance
 Brinker (EAT) Q2 Earnings and Revenues Surpass Estimates
Brinker International, Inc. EAT reported second-quarter fiscal 2023 results, with earnings and revenues surpassing the Zacks Consensus Estimate. The top and the bottom line increased on a year-over-year basis.
Kevin Hochman, chief executive officer and president of Brinker International, stated, "Our focus on the Team Member and Guest experience, coupled with a more strategic pricing strategy, has allowed us to grow our top line and sequentially improve our margins. We will build on this solid foundation as we continue to implement our strategic initiatives and move the business forward."
Earnings & Revenue Discussion
In the quarter under review, Brinker reported adjusted earnings per share (EPS) of 76 cents, surpassing the Zacks Consensus Estimate of 51 cents. In the prior-year quarter, the company reported an adjusted EPS of 71 cents.
Brinker International, Inc. Price, Consensus and EPS Surprise
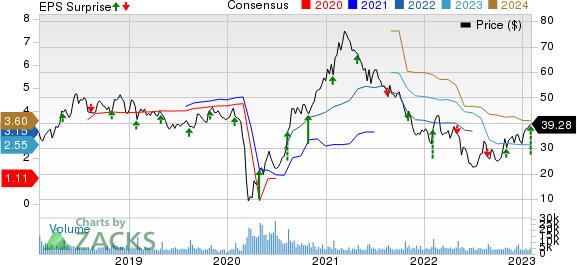
Brinker International, Inc. price-consensus-eps-surprise-chart | Brinker International, Inc. Quote
In the fiscal second quarter, total revenues of $1,019 million beat the Zacks Consensus Estimate of $990 million. The top line increased 10.1% on a year-over-year basis. The company gained from the solid performance of Maggiano's.
Chili's
Chili’s revenues in the fiscal second quarter increased 8.7% year over year to $878.7 million. The gain was primarily due to increased menu pricing and the acquisition of 68 restaurants in fiscal 2022, marginally overshadowed by lower traffic.
Chili's company restaurant expenses (as a percentage of company sales) in the fiscal second quarter increased to 89.7% year over year from 88.6% reported in the prior-year quarter. The upside can be attributed to a rise in commodity costs, delivery fees, manager salary expenses, hourly wage rates, rent and utilities expenses, marginally offset by sales leverage.
Chili's company-owned traffic in the quarter declined 7.6% year over year against the 6.3% growth reported in the prior-year quarter.
The segment’s company-owned comps increased 8% in the fiscal second quarter from the year-ago quarter.
At Chili’s, domestic comps (including company-owned and franchised) rose 7.5% year over year compared with an 11.5% rise in the prior-year quarter’s levels.
Maggiano’s
Maggiano’s sales rose 19.3% year over year to $140.3 million, primarily due to an increase in the dining room and banquet traffic and a rise in menu pricing. This and growth in off-premise business added to the upside. Comps increased 21.2% year over year. Traffic in the quarter rose 8.4% year over year compared with a gain of 53.3% reported in the prior-year quarter.
Maggiano's company restaurant expenses (as a percentage of company sales) in the fiscal second quarter were 80.1% compared with 82.9% reported in the prior-year quarter. The decrease was primarily due to sales leverage. However, this was partially offset by commodity price inflation, higher hourly wage rates, delivery fees, and repair and maintenance costs.
Operating Results
Total operating costs and expenses in the fiscal second quarter were $978.3 million compared with $886 million reported in the year-ago quarter. The restaurant operating margin, as a percentage of company sales, was 11.6% compared with the 12.1% reported in the prior-year quarter.
Balance Sheet
As of Dec 28, 2022, cash and cash equivalents amounted to $14.7 million compared with $19.5 million as of Sep 28, 2022.
Long-term debt as of Dec 28, 2022, was $1,023.3 million compared with $1,020.8 million as of Sep 28, 2022. Total shareholders’ deficit in the reported quarter was ($267.5) million compared with ($296.6) million reported in the previous quarter.
Fiscal 2023 Outlook
For fiscal 2023, The company anticipates total revenues in the range of $4.05-$4.15 billion. Capital expenditures are expected in the range of $170-$180 million. The company expects fiscal 2023 diluted EPS in the range of $2.60-$2.90.
Zacks Rank & Key Picks
Brinker currently carries a Zacks Rank #3 (Hold). You can see the complete list of today’s Zacks Rank #1 (Strong Buy) stocks here.
Some other top-ranked stocks in the Zacks Retail-Wholesale sector are Compass Group PLC CMPGY, Darden Restaurants, Inc. DRI and Yum! Brands, Inc. YUM.
Compass Group carries a Zacks Rank #2 (Buy). CMPGY has a long-term earnings growth rate of 19.6%. The stock has gained 3.4% in the past year.
The Zacks Consensus Estimate for Compass Group’s 2023 sales and EPS suggests growth of 44.4% and 24.7%, respectively, from the year-ago period’s reported levels.
Darden carries a Zacks Rank #2. DRI has a long-term earnings growth rate of 9.8%. Shares of DRI have gained 4.4% in the past year.
The Zacks Consensus Estimate for Darden’s 2023 sales and EPS suggests growth of 7.9% and 5.4%, respectively, from the year-ago period’s reported levels.
Yum! Brands currently carries a Zacks Rank #2. YUM has a long-term earnings growth rate of 11.5%. Shares of YUM have gained 3.1% in the past year.
The Zacks Consensus Estimate for Yum! Brands’ 2023 sales and EPS suggests growth of 6.5% and 15.6%, respectively, from the year-ago period’s reported levels.
Want the latest recommendations from Zacks Investment Research? Today, you can download 7 Best Stocks for the Next 30 Days. Click to get this free report
Yum! Brands, Inc. (YUM) : Free Stock Analysis Report
Darden Restaurants, Inc. (DRI) : Free Stock Analysis Report
Brinker International, Inc. (EAT) : Free Stock Analysis Report
Compass Group PLC (CMPGY) : Free Stock Analysis Report
