
 Yahoo Finance
 BT Group's (LON:BT.A) Returns On Capital Not Reflecting Well On The Business
If we want to find a stock that could multiply over the long term, what are the underlying trends we should look for? In a perfect world, we'd like to see a company investing more capital into its business and ideally the returns earned from that capital are also increasing. This shows us that it's a compounding machine, able to continually reinvest its earnings back into the business and generate higher returns. Having said that, from a first glance at BT Group (LON:BT.A) we aren't jumping out of our chairs at how returns are trending, but let's have a deeper look.
Understanding Return On Capital Employed (ROCE)
If you haven't worked with ROCE before, it measures the 'return' (pre-tax profit) a company generates from capital employed in its business. Analysts use this formula to calculate it for BT Group:
Return on Capital Employed = Earnings Before Interest and Tax (EBIT) ÷ (Total Assets - Current Liabilities)
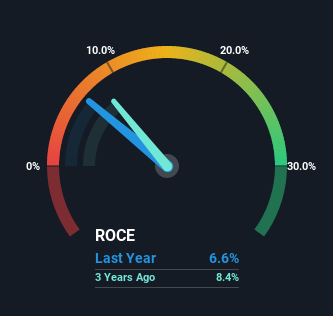
0.066 = UK£2.9b ÷ (UK£54b - UK£9.9b) (Based on the trailing twelve months to December 2022).
Therefore, BT Group has an ROCE of 6.6%. In absolute terms, that's a low return and it also under-performs the Telecom industry average of 9.6%.
Check out our latest analysis for BT Group
In the above chart we have measured BT Group's prior ROCE against its prior performance, but the future is arguably more important. If you're interested, you can view the analysts predictions in our free report on analyst forecasts for the company.
What Can We Tell From BT Group's ROCE Trend?
When we looked at the ROCE trend at BT Group, we didn't gain much confidence. To be more specific, ROCE has fallen from 12% over the last five years. However it looks like BT Group might be reinvesting for long term growth because while capital employed has increased, the company's sales haven't changed much in the last 12 months. It's worth keeping an eye on the company's earnings from here on to see if these investments do end up contributing to the bottom line.
In Conclusion...
Bringing it all together, while we're somewhat encouraged by BT Group's reinvestment in its own business, we're aware that returns are shrinking. And in the last five years, the stock has given away 17% so the market doesn't look too hopeful on these trends strengthening any time soon. Therefore based on the analysis done in this article, we don't think BT Group has the makings of a multi-bagger.
If you want to continue researching BT Group, you might be interested to know about the 2 warning signs that our analysis has discovered.
While BT Group isn't earning the highest return, check out this free list of companies that are earning high returns on equity with solid balance sheets.
Have feedback on this article? Concerned about the content? Get in touch with us directly. Alternatively, email editorial-team (at) simplywallst.com.
This article by Simply Wall St is general in nature. We provide commentary based on historical data and analyst forecasts only using an unbiased methodology and our articles are not intended to be financial advice. It does not constitute a recommendation to buy or sell any stock, and does not take account of your objectives, or your financial situation. We aim to bring you long-term focused analysis driven by fundamental data. Note that our analysis may not factor in the latest price-sensitive company announcements or qualitative material. Simply Wall St has no position in any stocks mentioned.
Join A Paid User Research Session
You’ll receive a US$30 Amazon Gift card for 1 hour of your time while helping us build better investing tools for the individual investors like yourself. Sign up here
