
 Yahoo Finance
 Bucher Industries' (VTX:BUCN) three-year earnings growth trails the 9.5% YoY shareholder returns
By buying an index fund, investors can approximate the average market return. But many of us dare to dream of bigger returns, and build a portfolio ourselves. Just take a look at Bucher Industries AG (VTX:BUCN), which is up 22%, over three years, soundly beating the market return of 1.6% (not including dividends).
After a strong gain in the past week, it's worth seeing if longer term returns have been driven by improving fundamentals.
Check out our latest analysis for Bucher Industries
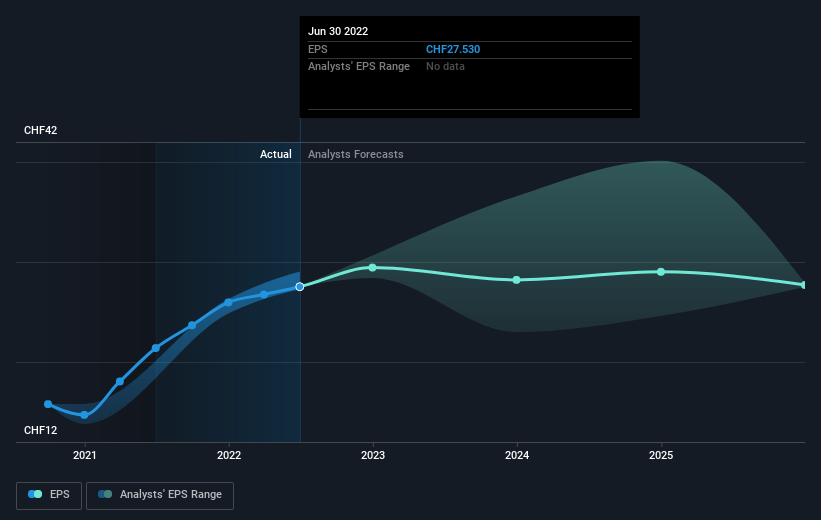
While markets are a powerful pricing mechanism, share prices reflect investor sentiment, not just underlying business performance. One imperfect but simple way to consider how the market perception of a company has shifted is to compare the change in the earnings per share (EPS) with the share price movement.
During three years of share price growth, Bucher Industries achieved compound earnings per share growth of 7.5% per year. We don't think it is entirely coincidental that the EPS growth is reasonably close to the 7% average annual increase in the share price. This suggests that sentiment and expectations have not changed drastically. Quite to the contrary, the share price has arguably reflected the EPS growth.
The graphic below depicts how EPS has changed over time (unveil the exact values by clicking on the image).
We know that Bucher Industries has improved its bottom line lately, but is it going to grow revenue? This free report showing analyst revenue forecasts should help you figure out if the EPS growth can be sustained.
What About Dividends?
It is important to consider the total shareholder return, as well as the share price return, for any given stock. The TSR is a return calculation that accounts for the value of cash dividends (assuming that any dividend received was reinvested) and the calculated value of any discounted capital raisings and spin-offs. So for companies that pay a generous dividend, the TSR is often a lot higher than the share price return. We note that for Bucher Industries the TSR over the last 3 years was 31%, which is better than the share price return mentioned above. The dividends paid by the company have thusly boosted the total shareholder return.
A Different Perspective
Although it hurts that Bucher Industries returned a loss of 6.2% in the last twelve months, the broader market was actually worse, returning a loss of 11%. Of course, the long term returns are far more important and the good news is that over five years, the stock has returned 1.2% for each year. It could be that the business is just facing some short term problems, but shareholders should keep a close eye on the fundamentals. While it is well worth considering the different impacts that market conditions can have on the share price, there are other factors that are even more important. For example, we've discovered 1 warning sign for Bucher Industries that you should be aware of before investing here.
But note: Bucher Industries may not be the best stock to buy. So take a peek at this free list of interesting companies with past earnings growth (and further growth forecast).
Please note, the market returns quoted in this article reflect the market weighted average returns of stocks that currently trade on CH exchanges.
Have feedback on this article? Concerned about the content? Get in touch with us directly. Alternatively, email editorial-team (at) simplywallst.com.
This article by Simply Wall St is general in nature. We provide commentary based on historical data and analyst forecasts only using an unbiased methodology and our articles are not intended to be financial advice. It does not constitute a recommendation to buy or sell any stock, and does not take account of your objectives, or your financial situation. We aim to bring you long-term focused analysis driven by fundamental data. Note that our analysis may not factor in the latest price-sensitive company announcements or qualitative material. Simply Wall St has no position in any stocks mentioned.
Join A Paid User Research Session
You’ll receive a US$30 Amazon Gift card for 1 hour of your time while helping us build better investing tools for the individual investors like yourself. Sign up here
