Bullish NFP Data Could Trigger Breakdown Under $1893.20
Gold futures are trading lower shortly before the release of the March US Non-Farm Payrolls report at 12:30 GMT. Gold is under pressure due to higher US Treasury yields and a stronger U.S. Dollar.
At 11:57 GMT, June Comex gold futures are trading $1932.70, down $21.30 or -1.09%. On Thursday, the SPDR Gold Shares ETF (GLD) settled at $180.68, up $0.10 or +0.06%.
US Non-Farm Payrolls Report
Today’s U.S. Non-Farm Payrolls report could help the Federal Reserve determine whether it will hike interest rates up to 50 basis points at its May monetary policy meeting.
A downside surprise should not dent market expectations for an aggressive series of rate hikes for 2022. The Fed will get the greenlight to act as aggressively as it wanted if the NFP report delivers better-than-expected news. This would confirm the strength of the U.S. economy.
Economists expect that about 490,000 jobs were added in March, according to the consensus estimate from Dow Jones, following a 678,000 payrolls addition in February. The unemployment rate is expected to fall to 3.7% from 3.8%, according to Dow Jones.
Average Hourly Earnings will be of particular interest for investors because they represent wage inflation. The premarket estimates show Average Hourly Earnings coming in at 0.4%.

Daily Swing Chart Technical Analysis
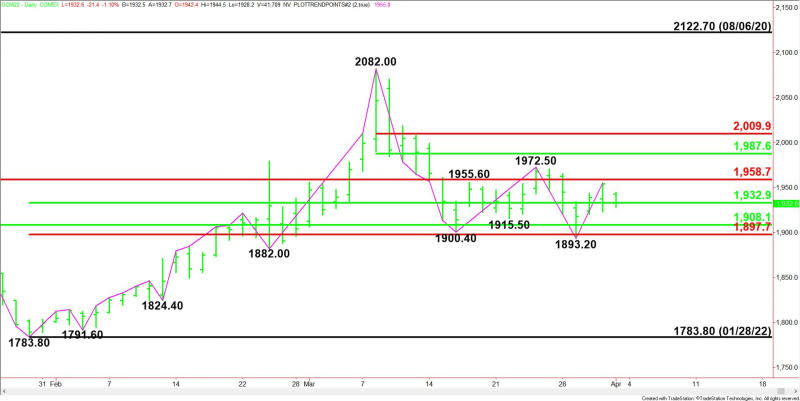
The main trend is down according to the daily swing chart. A trade through $1893.20 will reaffirm the downtrend. Taking out $1972.50 will change the main trend to up.
The market is currently trapped inside a pair of retracement zones at $1908.10 to $1958.70 and $1932.90 to $1897.70. These levels have controlled the price action for over two weeks.
The short-term range is $2082.00 to $1893.20. Its retracement zone at $1987.60 to $2009.90 is the primary upside target.
Daily Swing Chart Technical Forecast
The direction of the June Comex gold futures contract on Friday is likely to be determined by trader reaction to $1932.90.
Bearish Scenario
A sustained move under $1932.90 will indicate the presence of sellers. This move could create the downside momentum needed to challenge $1908.10, $1897.70 and the main bottom at $1893.20.
Taking out $1893.20 could trigger an acceleration into the next main bottom at $1882.00. This is a potential trigger point for an acceleration to the downside.
Bullish Scenario
A sustained move over $1932.90 will signal the presence of buyers. This move could generate the momentum neeed to challenge $1958.70. Taking out this level should lead to a test of the main top at $1972.50.
A trade through $1972.50 will change the main trend to up with $1987.60 to $2009.90 the next major target zone.
For a look at all of today’s economic events, check out our economic calendar.
This article was originally posted on FX Empire

 Yahoo Finance