
 Yahoo Finance
 Bullish SemGroup Corporation (NYSE:SEMG) Insiders Ramp Up Investment In Stock

SemGroup Corporation provides gathering, transportation, storage, distribution, marketing, and other midstream services for producers, refiners of petroleum products, and other market participants. SemGroup is one of United States’s large-cap stocks that saw some insider buying over the past three months, with insiders investing in 293.36k shares during this period. It is widely considered that insider buying stock in their own companies is potentially a bullish signal. A research published in The MIT Press (1998) concluded that stocks following insider buying outperformed the market by 4.5%. However, these signals may not be enough to gain conviction on whether to invest. I’ve assessed two potential reasons behind the insiders’ latest motivation to buy more shares. View out our latest analysis for SemGroup
Who Are Ramping Up Their Shares?
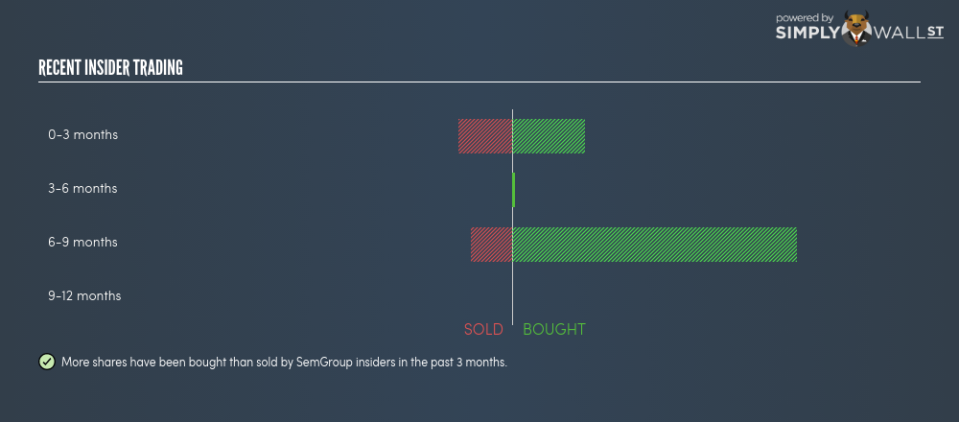
More shares have been bought than sold by SemGroup insiders in the past three months. In total, individual insiders own less than one million shares in the business, or around 0.85% of total shares outstanding.
Is This Consistent With Future Growth?
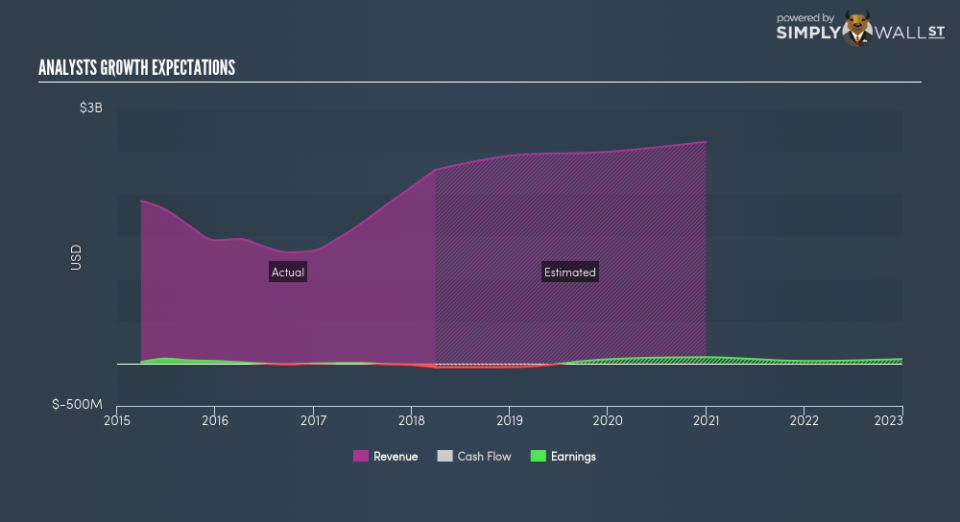
At first glance, SemGroup’s future looks muted. Probing further into annual growth rates, SemGroup is expected to experience a limited level of revenue growth next year, but a significantly higher expected earnings growth. Generally, this difference can be explained by a large drop in cost growth. Net buying could signal high insider confidence, perhaps due to their belief of sustainable growth. Or they may simply see the current stock price is undervalued relative to intrinsic value.
Did Insiders Buy On Share Price Volatility?
Alternatively, the timing of these insider transactions may have been driven by share price volatility. This means, if insiders believe shares were heavily undervalued recently, this would provide a prime opportunity to buy more irrespective of its growth outlook. SemGroup’s shares ranged between $26.1 and $20.45 over the past three months. This suggests reasonable volatility with a change of 27.63%. Perhaps not a significant enough movement to warrant transactions, thus motivation may be a result of their belief in the company in the future or simply personal portfolio rebalancing.
Next Steps:
SemGroup’s insider meaningful buying activity tells us the shares are currently in favour, which is consistent with the significant expected earnings growth, even if the low share price volatility did not warrant exploiting any mispricing. Although insider buying can be a useful prompt, following the lead of an insider, however, will never replace diligent research. I’ve compiled two key aspects you should look at:
Financial Health: Does SemGroup have a healthy balance sheet? Take a look at our free balance sheet analysis with six simple checks on key factors like leverage and risk.
Other High Quality Alternatives : Are there other high quality stocks you could be holding instead of SemGroup? Explore our interactive list of high quality stocks to get an idea of what else is out there you may be missing!
NB: Figures in this article are calculated using data from the last twelve months, which refer to the 12-month period ending on the last date of the month the financial statement is dated. This may not be consistent with full year annual report figures.
To help readers see pass the short term volatility of the financial market, we aim to bring you a long-term focused research analysis purely driven by fundamental data. Note that our analysis does not factor in the latest price sensitive company announcements.
The author is an independent contributor and at the time of publication had no position in the stocks mentioned.
