
 Yahoo Finance
 The Burberry Group (LON:BRBY) Share Price Is Up 26% And Shareholders Are Holding On

By buying an index fund, investors can approximate the average market return. But if you choose individual stocks with prowess, you can make superior returns. For example, the Burberry Group plc (LON:BRBY) share price is up 26% in the last three years, clearly besting the market return of around 5.8% (not including dividends). On the other hand, the returns haven't been quite so good recently, with shareholders up just 18% , including dividends .
Check out our latest analysis for Burberry Group
While markets are a powerful pricing mechanism, share prices reflect investor sentiment, not just underlying business performance. One flawed but reasonable way to assess how sentiment around a company has changed is to compare the earnings per share (EPS) with the share price.
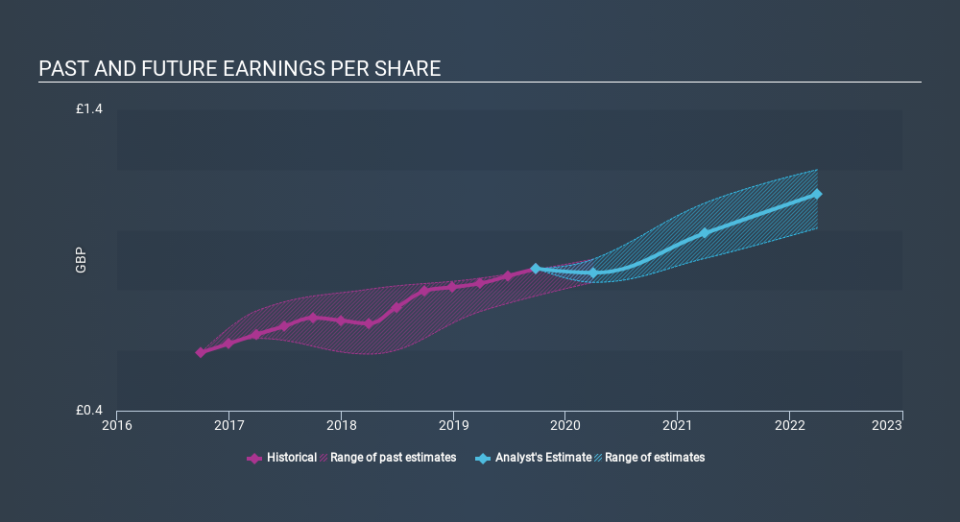
During three years of share price growth, Burberry Group achieved compound earnings per share growth of 14% per year. The average annual share price increase of 7.9% is actually lower than the EPS growth. So it seems investors have become more cautious about the company, over time.
You can see how EPS has changed over time in the image below (click on the chart to see the exact values).
We consider it positive that insiders have made significant purchases in the last year. Even so, future earnings will be far more important to whether current shareholders make money. It might be well worthwhile taking a look at our free report on Burberry Group's earnings, revenue and cash flow.
What About Dividends?
As well as measuring the share price return, investors should also consider the total shareholder return (TSR). The TSR incorporates the value of any spin-offs or discounted capital raisings, along with any dividends, based on the assumption that the dividends are reinvested. It's fair to say that the TSR gives a more complete picture for stocks that pay a dividend. In the case of Burberry Group, it has a TSR of 34% for the last 3 years. That exceeds its share price return that we previously mentioned. The dividends paid by the company have thusly boosted the total shareholder return.
A Different Perspective
Burberry Group shareholders have received returns of 18% over twelve months (even including dividends) , which isn't far from the general market return. That gain looks pretty satisfying, and it is even better than the five-year TSR of 6.0% per year. Even if the share price growth slows down from here, there's a good chance that this is business worth watching in the long term. Investors who like to make money usually check up on insider purchases, such as the price paid, and total amount bought. You can find out about the insider purchases of Burberry Group by clicking this link.
Burberry Group is not the only stock insiders are buying. So take a peek at this free list of growing companies with insider buying.
Please note, the market returns quoted in this article reflect the market weighted average returns of stocks that currently trade on GB exchanges.
If you spot an error that warrants correction, please contact the editor at editorial-team@simplywallst.com. This article by Simply Wall St is general in nature. It does not constitute a recommendation to buy or sell any stock, and does not take account of your objectives, or your financial situation. Simply Wall St has no position in the stocks mentioned.
We aim to bring you long-term focused research analysis driven by fundamental data. Note that our analysis may not factor in the latest price-sensitive company announcements or qualitative material. Thank you for reading.
