
 Yahoo Finance
 What Is Burberry Group's (LON:BRBY) P/E Ratio After Its Share Price Tanked?

Unfortunately for some shareholders, the Burberry Group (LON:BRBY) share price has dived 34% in the last thirty days. Even longer term holders have taken a real hit with the stock declining 30% in the last year.
All else being equal, a share price drop should make a stock more attractive to potential investors. In the long term, share prices tend to follow earnings per share, but in the short term prices bounce around in response to short term factors (which are not always obvious). So, on certain occasions, long term focussed investors try to take advantage of pessimistic expectations to buy shares at a better price. One way to gauge market expectations of a stock is to look at its Price to Earnings Ratio (PE Ratio). A high P/E implies that investors have high expectations of what a company can achieve compared to a company with a low P/E ratio.
Check out our latest analysis for Burberry Group
Does Burberry Group Have A Relatively High Or Low P/E For Its Industry?
Burberry Group's P/E of 14.98 indicates some degree of optimism towards the stock. The image below shows that Burberry Group has a higher P/E than the average (13.8) P/E for companies in the luxury industry.
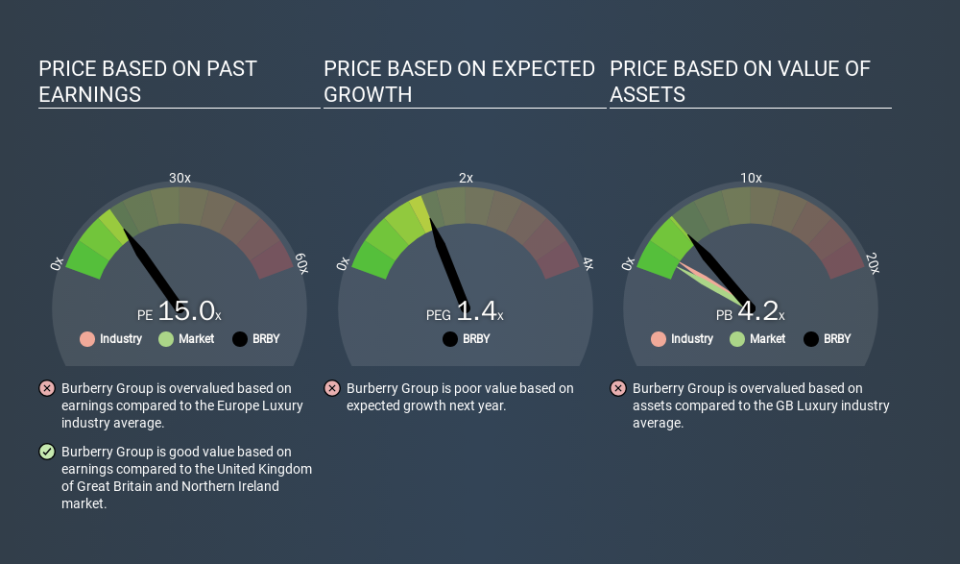
Its relatively high P/E ratio indicates that Burberry Group shareholders think it will perform better than other companies in its industry classification. Shareholders are clearly optimistic, but the future is always uncertain. So further research is always essential. I often monitor director buying and selling.
How Growth Rates Impact P/E Ratios
Probably the most important factor in determining what P/E a company trades on is the earnings growth. Earnings growth means that in the future the 'E' will be higher. That means even if the current P/E is high, it will reduce over time if the share price stays flat. Then, a lower P/E should attract more buyers, pushing the share price up.
Burberry Group saw earnings per share improve by -9.4% last year. And it has bolstered its earnings per share by 4.0% per year over the last five years.
Don't Forget: The P/E Does Not Account For Debt or Bank Deposits
Don't forget that the P/E ratio considers market capitalization. So it won't reflect the advantage of cash, or disadvantage of debt. Theoretically, a business can improve its earnings (and produce a lower P/E in the future) by investing in growth. That means taking on debt (or spending its cash).
Spending on growth might be good or bad a few years later, but the point is that the P/E ratio does not account for the option (or lack thereof).
Burberry Group's Balance Sheet
Burberry Group has net cash of UK£670m. This is fairly high at 13% of its market capitalization. That might mean balance sheet strength is important to the business, but should also help push the P/E a bit higher than it would otherwise be.
The Bottom Line On Burberry Group's P/E Ratio
Burberry Group trades on a P/E ratio of 15.0, which is above its market average of 13.9. EPS was up modestly better over the last twelve months. And the healthy balance sheet means the company can sustain growth while the P/E suggests shareholders think it will. What can be absolutely certain is that the market has become significantly less optimistic about Burberry Group over the last month, with the P/E ratio falling from 22.8 back then to 15.0 today. For those who don't like to trade against momentum, that could be a warning sign, but a contrarian investor might want to take a closer look.
Investors should be looking to buy stocks that the market is wrong about. People often underestimate remarkable growth -- so investors can make money when fast growth is not fully appreciated. So this free visual report on analyst forecasts could hold the key to an excellent investment decision.
Of course, you might find a fantastic investment by looking at a few good candidates. So take a peek at this free list of companies with modest (or no) debt, trading on a P/E below 20.
If you spot an error that warrants correction, please contact the editor at editorial-team@simplywallst.com. This article by Simply Wall St is general in nature. It does not constitute a recommendation to buy or sell any stock, and does not take account of your objectives, or your financial situation. Simply Wall St has no position in the stocks mentioned.
We aim to bring you long-term focused research analysis driven by fundamental data. Note that our analysis may not factor in the latest price-sensitive company announcements or qualitative material. Thank you for reading.
