
 Yahoo Finance
 Burlington Stores (NYSE:BURL shareholders incur further losses as stock declines 4.6% this week, taking three-year losses to 41%
For many investors, the main point of stock picking is to generate higher returns than the overall market. But if you try your hand at stock picking, your risk returning less than the market. We regret to report that long term Burlington Stores, Inc. (NYSE:BURL) shareholders have had that experience, with the share price dropping 41% in three years, versus a market return of about 17%. More recently, the share price has dropped a further 13% in a month.
With the stock having lost 4.6% in the past week, it's worth taking a look at business performance and seeing if there's any red flags.
Check out our latest analysis for Burlington Stores
To quote Buffett, 'Ships will sail around the world but the Flat Earth Society will flourish. There will continue to be wide discrepancies between price and value in the marketplace...' One imperfect but simple way to consider how the market perception of a company has shifted is to compare the change in the earnings per share (EPS) with the share price movement.
Burlington Stores became profitable within the last five years. We would usually expect to see the share price rise as a result. So given the share price is down it's worth checking some other metrics too.
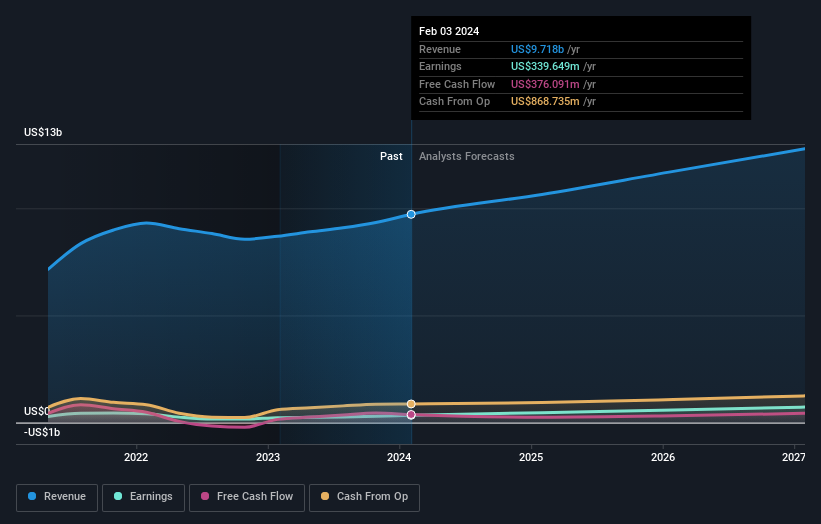
Revenue is actually up 9.1% over the three years, so the share price drop doesn't seem to hinge on revenue, either. It's probably worth investigating Burlington Stores further; while we may be missing something on this analysis, there might also be an opportunity.
The company's revenue and earnings (over time) are depicted in the image below (click to see the exact numbers).
Burlington Stores is a well known stock, with plenty of analyst coverage, suggesting some visibility into future growth. Given we have quite a good number of analyst forecasts, it might be well worth checking out this free chart depicting consensus estimates.
A Different Perspective
Burlington Stores shareholders are up 1.2% for the year. Unfortunately this falls short of the market return. On the bright side, the longer term returns (running at about 3% a year, over half a decade) look better. It's quite possible the business continues to execute with prowess, even as the share price gains are slowing. While it is well worth considering the different impacts that market conditions can have on the share price, there are other factors that are even more important. For example, we've discovered 2 warning signs for Burlington Stores that you should be aware of before investing here.
Of course Burlington Stores may not be the best stock to buy. So you may wish to see this free collection of growth stocks.
Please note, the market returns quoted in this article reflect the market weighted average returns of stocks that currently trade on American exchanges.
Have feedback on this article? Concerned about the content? Get in touch with us directly. Alternatively, email editorial-team (at) simplywallst.com.
This article by Simply Wall St is general in nature. We provide commentary based on historical data and analyst forecasts only using an unbiased methodology and our articles are not intended to be financial advice. It does not constitute a recommendation to buy or sell any stock, and does not take account of your objectives, or your financial situation. We aim to bring you long-term focused analysis driven by fundamental data. Note that our analysis may not factor in the latest price-sensitive company announcements or qualitative material. Simply Wall St has no position in any stocks mentioned.
