
 Yahoo Finance
 Should You Buy Consolidated Edison (ED) After Golden Cross?
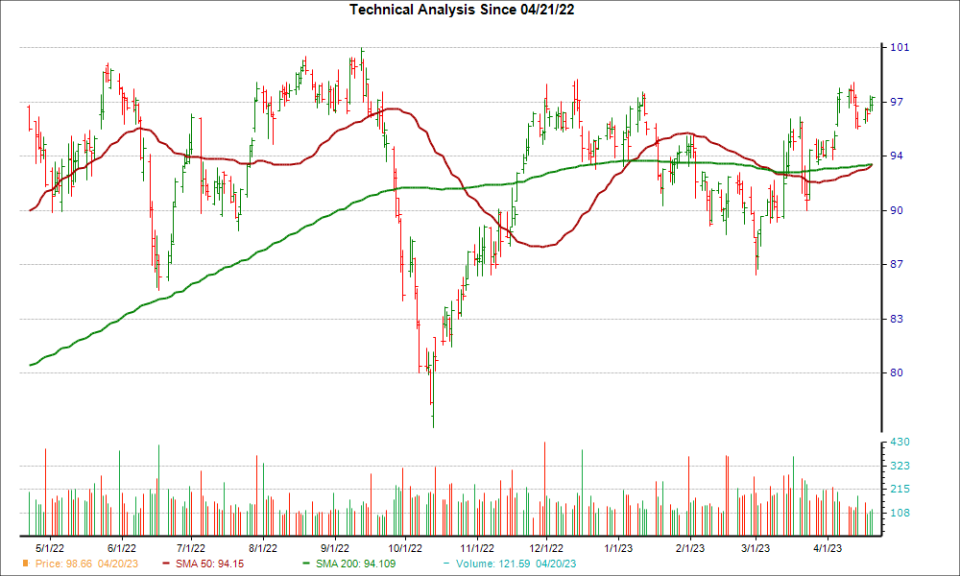
Consolidated Edison Inc (ED) is looking like an interesting pick from a technical perspective, as the company reached a key level of support. Recently, ED's 50-day simple moving average crossed above its 200-day simple moving average, known as a "golden cross."
There's a reason traders love a golden cross -- it's a technical chart pattern that can indicate a bullish breakout is on the horizon. This kind of crossover is formed when a stock's short-term moving average breaks above a longer-term moving average. Typically, a golden cross involves the 50-day and the 200-day moving averages, since bigger time periods tend to form stronger breakouts.
There are three stages to a golden cross. First, there must be a downtrend in a stock's price that eventually bottoms out. Then, the stock's shorter moving average crosses over its longer moving average, triggering a positive trend reversal. The third stage is when a stock continues the upward momentum to higher prices.
A golden cross is the opposite of a death cross, another technical event that indicates bearish price movement may be on the horizon.
Over the past four weeks, ED has gained 7.6%. The company currently sits at a #3 (Hold) on the Zacks Rank, also indicating that the stock could be poised for a breakout.
Looking at ED's earnings expectations, investors will be even more convinced of the bullish uptrend. For the current quarter, there have been 3 changes higher compared to none lower over the past 60 days, and the Zacks Consensus Estimate has moved up as well.
Investors may want to watch ED for more gains in the near future given the company's key technical level and positive earnings estimate revisions.
Want the latest recommendations from Zacks Investment Research? Today, you can download 7 Best Stocks for the Next 30 Days. Click to get this free report
Consolidated Edison Inc (ED) : Free Stock Analysis Report
