
 Yahoo Finance
 Before You Buy Funcom N.V. (OB:FUNCOM), Consider Its Volatility

Want to participate in a research study? Help shape the future of investing tools and earn a $60 gift card!
Anyone researching Funcom N.V. (OB:FUNCOM) might want to consider the historical volatility of the share price. Modern finance theory considers volatility to be a measure of risk, and there are two main types of price volatility. The first category is company specific volatility. This can be dealt with by limiting your exposure to any particular stock. The other type, which cannot be diversified away, is the volatility of the entire market. Every stock in the market is exposed to this volatility, which is linked to the fact that stocks prices are correlated in an efficient market.
Some stocks are more sensitive to general market forces than others. Beta is a widely used metric to measure a stock's exposure to market risk (volatility). Before we go on, it's worth noting that Warren Buffett pointed out in his 2014 letter to shareholders that 'volatility is far from synonymous with risk.' Having said that, beta can still be rather useful. The first thing to understand about beta is that the beta of the overall market is one. A stock with a beta greater than one is more sensitive to broader market movements than a stock with a beta of less than one.
Check out our latest analysis for Funcom
What does FUNCOM's beta value mean to investors?
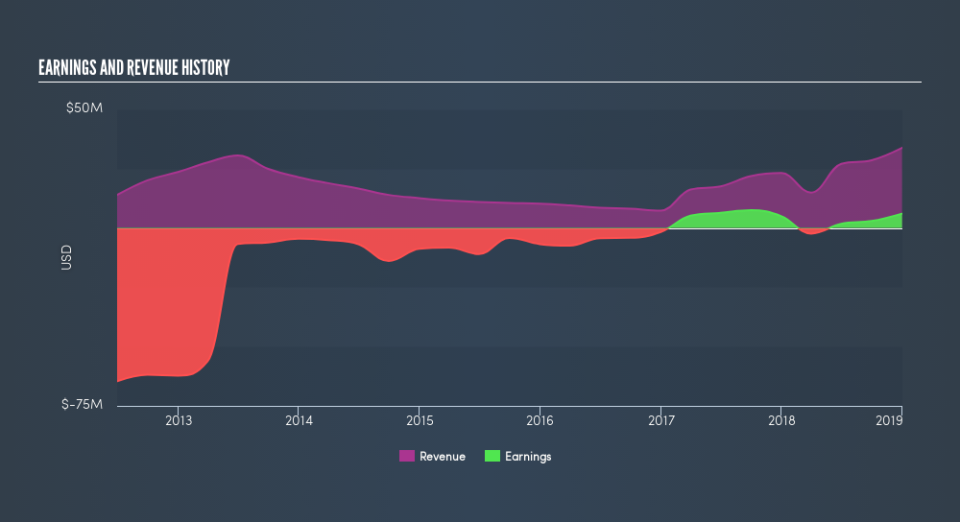
As it happens, Funcom has a five year beta of 0.94. This is fairly close to 1, so the stock has historically shown a somewhat similar level of volatility as the market. If the future looks like the past, we could therefore consider it likely that the stock price will experience share price volatility that is roughly similar to the overall market. Many would argue that beta is useful in position sizing, but fundamental metrics such as revenue and earnings are more important overall. You can see Funcom's revenue and earnings in the image below.
How does FUNCOM's size impact its beta?
Funcom is a rather small company. It has a market capitalisation of øre1.2b, which means it is probably under the radar of most investors. Companies this small are usually more volatile than the market, whether or not that volatility is correlated. Therefore, it's a bit surprising to see that this stock has a beta value so close to the overall market.
What this means for you:
Since Funcom has a beta close to one, it will probably show a positive return when the market is moving up, based on history. If you're trying to generate better returns than the market, it would be worth thinking about other metrics such as cashflows, dividends and revenue growth might be a more useful guide to the future. This article aims to educate investors about beta values, but it's well worth looking at important company-specific fundamentals such as Funcom’s financial health and performance track record. I urge you to continue your research by taking a look at the following:
Future Outlook: What are well-informed industry analysts predicting for FUNCOM’s future growth? Take a look at our free research report of analyst consensus for FUNCOM’s outlook.
Past Track Record: Has FUNCOM been consistently performing well irrespective of the ups and downs in the market? Go into more detail in the past performance analysis and take a look at the free visual representations of FUNCOM's historicals for more clarity.
Other Interesting Stocks: It's worth checking to see how FUNCOM measures up against other companies on valuation. You could start with this free list of prospective options.
We aim to bring you long-term focused research analysis driven by fundamental data. Note that our analysis may not factor in the latest price-sensitive company announcements or qualitative material.
If you spot an error that warrants correction, please contact the editor at editorial-team@simplywallst.com. This article by Simply Wall St is general in nature. It does not constitute a recommendation to buy or sell any stock, and does not take account of your objectives, or your financial situation. Simply Wall St has no position in the stocks mentioned. Thank you for reading.
