
 Yahoo Finance
 Should You Buy Harworth Group plc (LSE:HWG) At This PE Ratio?

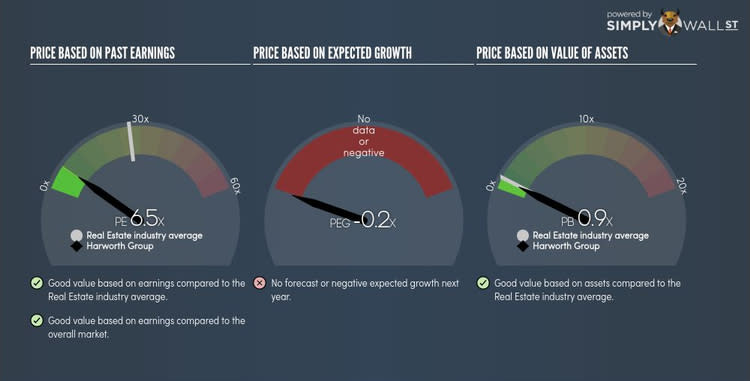
Harworth Group plc (LSE:HWG) is currently trading at a trailing P/E of 6.5x, which is lower than the industry average of 13.8x. While this makes HWG appear like a great stock to buy, you might change your mind after I explain the assumptions behind the P/E ratio. Today, I will break down what the P/E ratio is, how to interpret it and what to watch out for. Check out our latest analysis for Harworth Group
What you need to know about the P/E ratio
The P/E ratio is one of many ratios used in relative valuation. By comparing a stock’s price per share to its earnings per share, we are able to see how much investors are paying for each pound of the company’s earnings.
Formula
Price-Earnings Ratio = Price per share ÷ Earnings per share
P/E Calculation for HWG
Price per share = 1.02
Earnings per share = 0.157
∴ Price-Earnings Ratio = 1.02 ÷ 0.157 = 6.5x
The P/E ratio itself doesn’t tell you a lot; however, it becomes very insightful when you compare it with other similar companies. Ultimately, our goal is to compare the stock’s P/E ratio to the average of companies that have similar attributes to HWG, such as company lifetime and products sold. A common peer group is companies that exist in the same industry, which is what I use below. Since it is expected that similar companies have similar P/E ratios, we can come to some conclusions about the stock if the ratios are different.
HWG’s P/E of 6.5x is lower than its industry peers (13.8x), which implies that each dollar of HWG’s earnings is being undervalued by investors. As such, our analysis shows that HWG represents an under-priced stock.
A few caveats
However, before you rush out to buy HWG, it is important to note that this conclusion is based on two key assumptions. The first is that our “similar companies” are actually similar to HWG. If the companies aren’t similar, the difference in P/E might be a result of other factors. For example, if you are inadvertently comparing lower risk firms with HWG, then HWG’s P/E would naturally be lower than its peers, since investors would value those with lower risk with a higher price. The other possibility is if you were accidentally comparing higher growth firms with HWG. In this case, HWG’s P/E would be lower since investors would also reward its peers’ higher growth with a higher price. The second assumption that must hold true is that the stocks we are comparing HWG to are fairly valued by the market. If this assumption does not hold true, HWG’s lower P/E ratio may be because firms in our peer group are being overvalued by the market.
What this means for you:
Are you a shareholder? You may have already conducted fundamental analysis on the stock as a shareholder, so its current undervaluation could signal a good buying opportunity to increase your exposure to HWG. Now that you understand the ins and outs of the PE metric, you should know to bear in mind its limitations before you make an investment decision.
Are you a potential investor? If you are considering investing in HWG, basing your decision on the PE metric at one point in time is certainly not sufficient. I recommend you do additional analysis by looking at its intrinsic valuation and using other relative valuation ratios like PEG or EV/EBITDA.
PE is one aspect of your portfolio construction to consider when holding or entering into a stock. But it is certainly not the only factor. Take a look at our most recent infographic report on Harworth Group for a more in-depth analysis of the stock to help you make a well-informed investment decision. Since we know a limitation of PE is it doesn't properly account for growth, you can use our free platform to see my list of stocks with a high growth potential and see if their PE is still reasonable.
To help readers see pass the short term volatility of the financial market, we aim to bring you a long-term focused research analysis purely driven by fundamental data. Note that our analysis does not factor in the latest price sensitive company announcements.
The author is an independent contributor and at the time of publication had no position in the stocks mentioned.
