
 Yahoo Finance
 Should You Buy Interface, Inc. (NASDAQ:TILE) For Its Dividend?

Want to participate in a short research study? Help shape the future of investing tools and you could win a $250 gift card!
Dividend paying stocks like Interface, Inc. (NASDAQ:TILE) tend to be popular with investors, and for good reason - some research suggests a significant amount of all stock market returns come from reinvested dividends. If you are hoping to live on your dividends, it's important to be more stringent with your investments than the average punter. Regular readers know we like to apply the same approach to each dividend stock, and we hope you'll find our analysis useful.
While Interface's 1.8% dividend yield is not the highest, we think its lengthy payment history is quite interesting. Some simple research can reduce the risk of buying Interface for its dividend - read on to learn more.
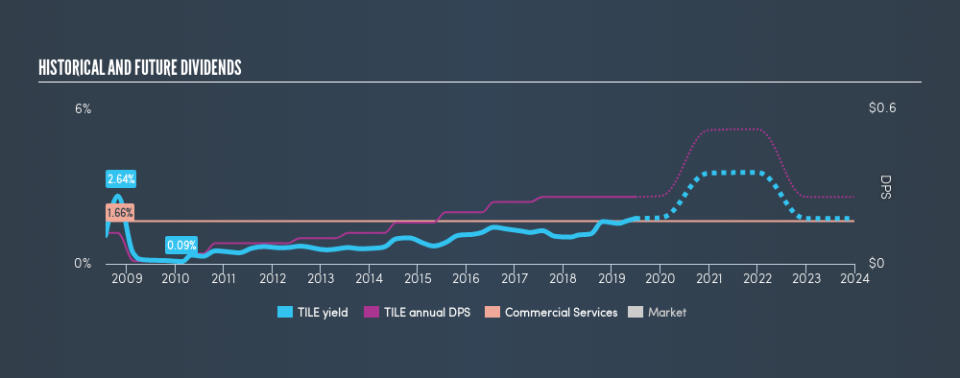
Explore this interactive chart for our latest analysis on Interface!
Payout ratios
Dividends are typically paid from company earnings. If a company pays more in dividends than it earned, then the dividend might become unsustainable - hardly an ideal situation. Comparing dividend payments to a company's net profit after tax is a simple way of reality-checking whether a dividend is sustainable. Interface paid out 37% of its profit as dividends, over the trailing twelve month period. This is medium payout level that leaves enough capital in the business to fund opportunities that might arise, while also rewarding shareholders. Plus, there is room to increase the payout ratio over time.
In addition to comparing dividends against profits, we should inspect whether the company generated enough cash to pay its dividend. The company paid out 84% of its free cash flow as dividends last year, which is adequate, but reduces the wriggle room in the event of a downturn. It's positive to see that Interface's dividend is covered by both profits and cash flow, since this is generally a sign that the dividend is sustainable, and a lower payout ratio usually suggests a greater margin of safety before the dividend gets cut.
Is Interface's Balance Sheet Risky?
As Interface has a meaningful amount of debt, we need to check its balance sheet to see if the company might have debt risks. A rough way to check this is with these two simple ratios: a) net debt divided by EBITDA (earnings before interest, tax, depreciation and amortisation), and b) net interest cover. Net debt to EBITDA measures total debt load relative to company earnings (lower = less debt), while net interest cover measures the ability to pay interest on the debt (higher = greater ability to pay interest costs). Interface is carrying net debt of 3.38 times its EBITDA, which is getting towards the upper limit of our comfort range on a dividend stock that the investor hopes will endure a wide range of economic circumstances.
Net interest cover can be calculated by dividing earnings before interest and tax (EBIT) by the company's net interest expense. Interface has EBIT of 6.07 times its interest expense, which we think is adequate.
We update our data on Interface every 24 hours, so you can always get our latest analysis of its financial health, here.
Dividend Volatility
From the perspective of an income investor who wants to earn dividends for many years, there is not much point buying a stock if its dividend is regularly cut or is not reliable. For the purpose of this article, we only scrutinise the last decade of Interface's dividend payments. Its dividend payments have fallen by 20% or more on at least one occasion over the past ten years. During the past ten-year period, the first annual payment was US$0.12 in 2009, compared to US$0.26 last year. Dividends per share have grown at approximately 8.0% per year over this time. The dividends haven't grown at precisely 8.0% every year, but this is a useful way to average out the historical rate of growth.
It's good to see the dividend growing at a decent rate, but the dividend has been cut at least once in the past. Interface might have put its house in order since then, but we remain cautious.
Dividend Growth Potential
With a relatively unstable dividend, it's even more important to see if earnings per share (EPS) are growing. Why take the risk of a dividend getting cut, unless there's a good chance of bigger dividends in future? While there may be fluctuations in the past , Interface's earnings per share have basically not grown from where they were five years ago. Flat earnings per share are acceptable for a time, but over the long term, the purchasing power of the company's dividends could be eroded by inflation.
Conclusion
Dividend investors should always want to know if a) a company's dividends are affordable, b) if there is a track record of consistent payments, and c) if the dividend is capable of growing. Firstly, we like that Interface pays out a low fraction of earnings. It pays out a higher percentage of its cashflow, although this is within acceptable bounds. Second, earnings per share have been in decline, and its dividend has been cut at least once in the past. In sum, we find it hard to get excited about Interface from a dividend perspective. It's not that we think it's a bad business; just that there are other companies that perform better on these criteria.
Given that earnings are not growing, the dividend does not look nearly so attractive. Very few businesses see earnings consistently shrink year after year in perpetuity though, and so it might be worth seeing what the 7 analysts we track are forecasting for the future.
Looking for more high-yielding dividend ideas? Try our curated list of dividend stocks with a yield above 3%.
We aim to bring you long-term focused research analysis driven by fundamental data. Note that our analysis may not factor in the latest price-sensitive company announcements or qualitative material.
If you spot an error that warrants correction, please contact the editor at editorial-team@simplywallst.com. This article by Simply Wall St is general in nature. It does not constitute a recommendation to buy or sell any stock, and does not take account of your objectives, or your financial situation. Simply Wall St has no position in the stocks mentioned. Thank you for reading.
