
 Yahoo Finance
 Should You Buy Rapala VMC Corporation (HEL:RAP1V) For Its 1.9% Dividend?

Want to participate in a short research study? Help shape the future of investing tools and you could win a $250 gift card!
Dividend paying stocks like Rapala VMC Corporation (HEL:RAP1V) tend to be popular with investors, and for good reason - some research suggests a significant amount of all stock market returns come from reinvested dividends. If you are hoping to live on the income from dividends, it's important to be a lot more stringent with your investments than the average punter.
A 1.9% yield is nothing to get excited about, but investors probably think the long payment history suggests Rapala VMC has some staying power. The company also bought back stock during the year, equivalent to approximately 0.6% of the company's market capitalisation at the time. There are a few simple ways to reduce the risks of buying Rapala VMC for its dividend, and we'll go through these below.
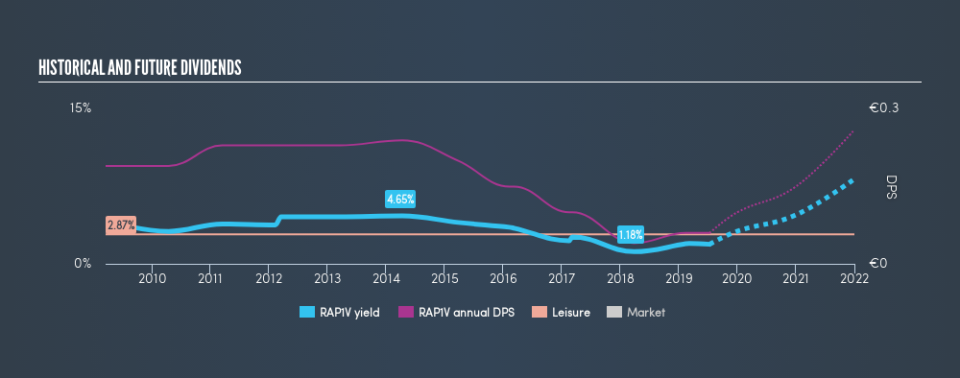
Click the interactive chart for our full dividend analysis
Payout ratios
Dividends are typically paid from company earnings. If a company pays more in dividends than it earned, then the dividend might become unsustainable - hardly an ideal situation. So we need to form a view on if a company's dividend is sustainable, relative to its net profit after tax. Looking at the data, we can see that 46% of Rapala VMC's profits were paid out as dividends in the last 12 months. This is a middling range that strikes a nice balance between paying dividends to shareholders, and retaining enough earnings to invest in future growth. Plus, there is room to increase the payout ratio over time.
In addition to comparing dividends against profits, we should inspect whether the company generated enough cash to pay its dividend. Rapala VMC paid out 933% of its free cash flow last year, suggesting the dividend is poorly covered by cash flow. Paying out such a high percentage of cash flow suggests that the dividend was funded from either cash at bank or by borrowing, neither of which is desirable over the long term. Rapala VMC paid out less in dividends than it reported in profits, but unfortunately it didn't generate enough free cash flow to cover the dividend. Cash is king, as they say, and were Rapala VMC to repeatedly pay dividends that aren't well covered by cashflow, we would consider this a warning sign.
Is Rapala VMC's Balance Sheet Risky?
As Rapala VMC has a meaningful amount of debt, we need to check its balance sheet to see if the company might have debt risks. A quick check of its financial situation can be done with two ratios: net debt divided by EBITDA (earnings before interest, tax, depreciation and amortisation), and net interest cover. Net debt to EBITDA is a measure of a company's total debt. Net interest cover measures the ability to meet interest payments. Essentially we check that a) the company does not have too much debt, and b) that it can afford to pay the interest. With net debt of 3.08 times its EBITDA, investors are starting to take on a meaningful amount of risk, should the business enter a downturn.
Net interest cover can be calculated by dividing earnings before interest and tax (EBIT) by the company's net interest expense. Rapala VMC has interest cover of more than 12 times its interest expense, which we think is quite strong.
Remember, you can always get a snapshot of Rapala VMC's latest financial position, by checking our visualisation of its financial health.
Dividend Volatility
Before buying a stock for its income, we want to see if the dividends have been stable in the past, and if the company has a track record of maintaining its dividend. For the purpose of this article, we only scrutinise the last decade of Rapala VMC's dividend payments. Its dividend payments have fallen by 20% or more on at least one occasion over the past ten years. During the past ten-year period, the first annual payment was €0.19 in 2009, compared to €0.06 last year. Dividend payments have fallen sharply, down 68% over that time.
We struggle to make a case for buying Rapala VMC for its dividend, given that payments have shrunk over the past ten years.
Dividend Growth Potential
Given that dividend payments have been shrinking like a glacier in a warming world, we need to check if there are some bright spots on the horizon. In the last five years, Rapala VMC's earnings per share have shrunk at approximately 17% per annum. Declining earnings per share over a number of years is not a great sign for the dividend investor. Without some improvement, this does not bode well for the long term value of a company's dividend.
Conclusion
Dividend investors should always want to know if a) a company's dividends are affordable, b) if there is a track record of consistent payments, and c) if the dividend is capable of growing. Firstly, the company has a conservative payout ratio, although we'd note that its cashflow in the past year was substantially lower than its reported profit. Earnings per share have been falling, and the company has cut its dividend at least once in the past. From a dividend perspective, this is a cause for concern. In summary, Rapala VMC has a number of shortcomings that we'd find it hard to get past. Things could change, but we think there are a number of better ideas out there.
Are management backing themselves to deliver performance? Check their shareholdings in Rapala VMC in our latest insider ownership analysis.
We have also put together a list of global stocks with a market capitalisation above $1bn and yielding more 3%.
We aim to bring you long-term focused research analysis driven by fundamental data. Note that our analysis may not factor in the latest price-sensitive company announcements or qualitative material.
If you spot an error that warrants correction, please contact the editor at editorial-team@simplywallst.com. This article by Simply Wall St is general in nature. It does not constitute a recommendation to buy or sell any stock, and does not take account of your objectives, or your financial situation. Simply Wall St has no position in the stocks mentioned. Thank you for reading.
