
 Yahoo Finance
 Cabot Oil & Gas (NYSE:COG) Shareholders Booked A 33% Gain In The Last Year
On average, over time, stock markets tend to rise higher. This makes investing attractive. But not every stock you buy will perform as well as the overall market. Over the last year the Cabot Oil & Gas Corporation (NYSE:COG) share price is up 33%, but that's less than the broader market return. Unfortunately the longer term returns are not so good, with the stock falling 27% in the last three years.
See our latest analysis for Cabot Oil & Gas
There is no denying that markets are sometimes efficient, but prices do not always reflect underlying business performance. One way to examine how market sentiment has changed over time is to look at the interaction between a company's share price and its earnings per share (EPS).
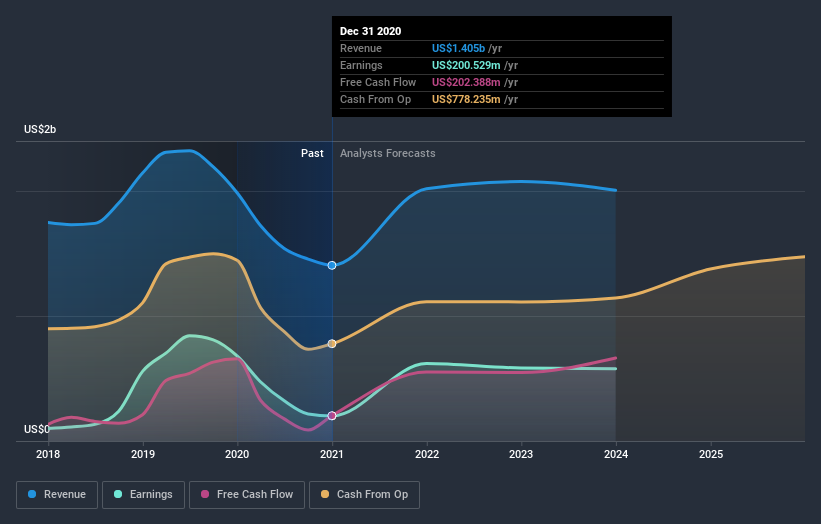
During the last year, Cabot Oil & Gas actually saw its earnings per share drop 69%.
Given the share price gain, we doubt the market is measuring progress with EPS. Therefore, it seems likely that investors are putting more weight on metrics other than EPS, at the moment.
Unfortunately Cabot Oil & Gas' fell 29% over twelve months. So using a snapshot of key business metrics doesn't give us a good picture of why the market is bidding up the stock.
The graphic below depicts how earnings and revenue have changed over time (unveil the exact values by clicking on the image).
Cabot Oil & Gas is a well known stock, with plenty of analyst coverage, suggesting some visibility into future growth. So we recommend checking out this free report showing consensus forecasts
What About Dividends?
When looking at investment returns, it is important to consider the difference between total shareholder return (TSR) and share price return. The TSR is a return calculation that accounts for the value of cash dividends (assuming that any dividend received was reinvested) and the calculated value of any discounted capital raisings and spin-offs. Arguably, the TSR gives a more comprehensive picture of the return generated by a stock. We note that for Cabot Oil & Gas the TSR over the last year was 36%, which is better than the share price return mentioned above. The dividends paid by the company have thusly boosted the total shareholder return.
A Different Perspective
Cabot Oil & Gas provided a TSR of 36% over the year (including dividends). That's fairly close to the broader market return. To take a positive view, the gain is pleasing, and it sure beats annualized TSR loss of 1.6%, which was endured over half a decade. While 'turnarounds seldom turn' there are green shoots for Cabot Oil & Gas. While it is well worth considering the different impacts that market conditions can have on the share price, there are other factors that are even more important. Take risks, for example - Cabot Oil & Gas has 3 warning signs we think you should be aware of.
We will like Cabot Oil & Gas better if we see some big insider buys. While we wait, check out this free list of growing companies with considerable, recent, insider buying.
Please note, the market returns quoted in this article reflect the market weighted average returns of stocks that currently trade on US exchanges.
This article by Simply Wall St is general in nature. It does not constitute a recommendation to buy or sell any stock, and does not take account of your objectives, or your financial situation. We aim to bring you long-term focused analysis driven by fundamental data. Note that our analysis may not factor in the latest price-sensitive company announcements or qualitative material. Simply Wall St has no position in any stocks mentioned.
Have feedback on this article? Concerned about the content? Get in touch with us directly. Alternatively, email editorial-team (at) simplywallst.com.
