
 Yahoo Finance
 Caffyns (LON:CFYN) Might Have The Makings Of A Multi-Bagger
If we want to find a potential multi-bagger, often there are underlying trends that can provide clues. Typically, we'll want to notice a trend of growing return on capital employed (ROCE) and alongside that, an expanding base of capital employed. Ultimately, this demonstrates that it's a business that is reinvesting profits at increasing rates of return. So when we looked at Caffyns (LON:CFYN) and its trend of ROCE, we really liked what we saw.
Understanding Return On Capital Employed (ROCE)
Just to clarify if you're unsure, ROCE is a metric for evaluating how much pre-tax income (in percentage terms) a company earns on the capital invested in its business. To calculate this metric for Caffyns, this is the formula:
Return on Capital Employed = Earnings Before Interest and Tax (EBIT) ÷ (Total Assets - Current Liabilities)
0.089 = UK£4.8m ÷ (UK£100m - UK£46m) (Based on the trailing twelve months to March 2023).
Thus, Caffyns has an ROCE of 8.9%. In absolute terms, that's a low return and it also under-performs the Specialty Retail industry average of 12%.
See our latest analysis for Caffyns
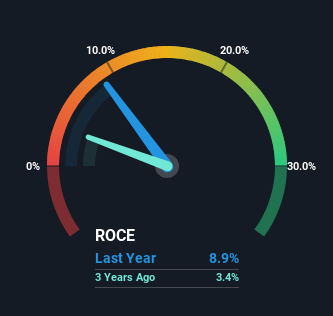
Historical performance is a great place to start when researching a stock so above you can see the gauge for Caffyns' ROCE against it's prior returns. If you're interested in investigating Caffyns' past further, check out this free graph of past earnings, revenue and cash flow.
So How Is Caffyns' ROCE Trending?
Caffyns has not disappointed with their ROCE growth. Looking at the data, we can see that even though capital employed in the business has remained relatively flat, the ROCE generated has risen by 103% over the last five years. So it's likely that the business is now reaping the full benefits of its past investments, since the capital employed hasn't changed considerably. On that front, things are looking good so it's worth exploring what management has said about growth plans going forward.
On a side note, Caffyns' current liabilities are still rather high at 46% of total assets. This can bring about some risks because the company is basically operating with a rather large reliance on its suppliers or other sorts of short-term creditors. Ideally we'd like to see this reduce as that would mean fewer obligations bearing risks.
In Conclusion...
As discussed above, Caffyns appears to be getting more proficient at generating returns since capital employed has remained flat but earnings (before interest and tax) are up. And investors seem to expect more of this going forward, since the stock has rewarded shareholders with a 42% return over the last five years. So given the stock has proven it has promising trends, it's worth researching the company further to see if these trends are likely to persist.
Caffyns does come with some risks though, we found 4 warning signs in our investment analysis, and 1 of those is concerning...
For those who like to invest in solid companies, check out this free list of companies with solid balance sheets and high returns on equity.
Have feedback on this article? Concerned about the content? Get in touch with us directly. Alternatively, email editorial-team (at) simplywallst.com.
This article by Simply Wall St is general in nature. We provide commentary based on historical data and analyst forecasts only using an unbiased methodology and our articles are not intended to be financial advice. It does not constitute a recommendation to buy or sell any stock, and does not take account of your objectives, or your financial situation. We aim to bring you long-term focused analysis driven by fundamental data. Note that our analysis may not factor in the latest price-sensitive company announcements or qualitative material. Simply Wall St has no position in any stocks mentioned.
