
 Yahoo Finance
 Cake Box Holdings (LON:CBOX) sheds 12% this week, as yearly returns fall more in line with earnings growth
Cake Box Holdings Plc (LON:CBOX) shareholders might understandably be very concerned that the share price has dropped 52% in the last quarter. On the other hand the share price is higher than it was three years ago. Arguably you'd have been better off buying an index fund, because the gain of 18% in three years isn't amazing.
Since the long term performance has been good but there's been a recent pullback of 12%, let's check if the fundamentals match the share price.
View our latest analysis for Cake Box Holdings
To quote Buffett, 'Ships will sail around the world but the Flat Earth Society will flourish. There will continue to be wide discrepancies between price and value in the marketplace...' One flawed but reasonable way to assess how sentiment around a company has changed is to compare the earnings per share (EPS) with the share price.
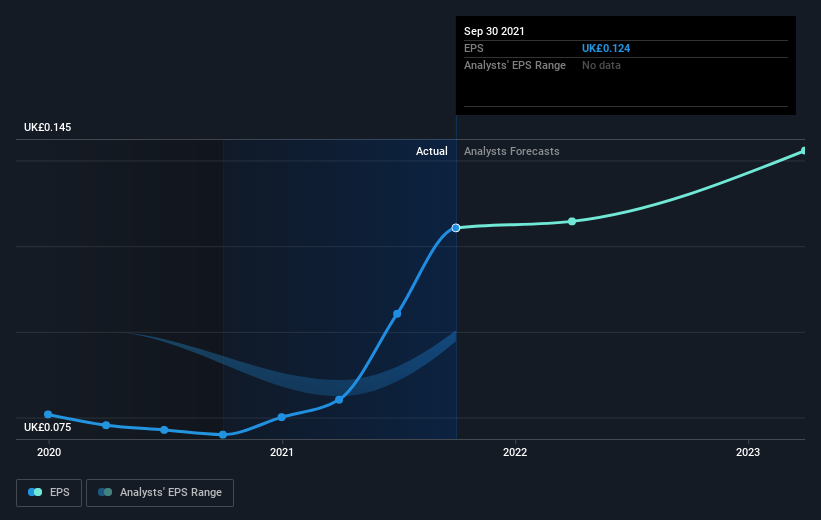
Cake Box Holdings was able to grow its EPS at 24% per year over three years, sending the share price higher. The average annual share price increase of 6% is actually lower than the EPS growth. Therefore, it seems the market has moderated its expectations for growth, somewhat.
The image below shows how EPS has tracked over time (if you click on the image you can see greater detail).
We know that Cake Box Holdings has improved its bottom line lately, but is it going to grow revenue? If you're interested, you could check this free report showing consensus revenue forecasts.
What About Dividends?
As well as measuring the share price return, investors should also consider the total shareholder return (TSR). The TSR incorporates the value of any spin-offs or discounted capital raisings, along with any dividends, based on the assumption that the dividends are reinvested. Arguably, the TSR gives a more comprehensive picture of the return generated by a stock. As it happens, Cake Box Holdings' TSR for the last 3 years was 27%, which exceeds the share price return mentioned earlier. This is largely a result of its dividend payments!
A Different Perspective
Cake Box Holdings shareholders are down 9.8% for the year, (even including dividends), but the broader market is up 13%. Of course the long term matters more than the short term, and even great stocks will sometimes have a poor year. Fortunately the longer term story is brighter, with total returns averaging about 8% per year over three years. The recent sell-off could be an opportunity if the business remains sound, so it may be worth checking the fundamental data for signs of a long-term growth trend. I find it very interesting to look at share price over the long term as a proxy for business performance. But to truly gain insight, we need to consider other information, too. For instance, we've identified 3 warning signs for Cake Box Holdings that you should be aware of.
But note: Cake Box Holdings may not be the best stock to buy. So take a peek at this free list of interesting companies with past earnings growth (and further growth forecast).
Please note, the market returns quoted in this article reflect the market weighted average returns of stocks that currently trade on GB exchanges.
Have feedback on this article? Concerned about the content? Get in touch with us directly. Alternatively, email editorial-team (at) simplywallst.com.
This article by Simply Wall St is general in nature. We provide commentary based on historical data and analyst forecasts only using an unbiased methodology and our articles are not intended to be financial advice. It does not constitute a recommendation to buy or sell any stock, and does not take account of your objectives, or your financial situation. We aim to bring you long-term focused analysis driven by fundamental data. Note that our analysis may not factor in the latest price-sensitive company announcements or qualitative material. Simply Wall St has no position in any stocks mentioned.
