
 Yahoo Finance
 Is CalAmp Corp. (NASDAQ:CAMP) A Financially Sound Company?

Want to participate in a short research study? Help shape the future of investing tools and you could win a $250 gift card!
Investors are always looking for growth in small-cap stocks like CalAmp Corp. (NASDAQ:CAMP), with a market cap of US$443m. However, an important fact which most ignore is: how financially healthy is the business? Assessing first and foremost the financial health is crucial, since poor capital management may bring about bankruptcies, which occur at a higher rate for small-caps. The following basic checks can help you get a picture of the company's balance sheet strength. However, this is just a partial view of the stock, and I recommend you dig deeper yourself into CAMP here.
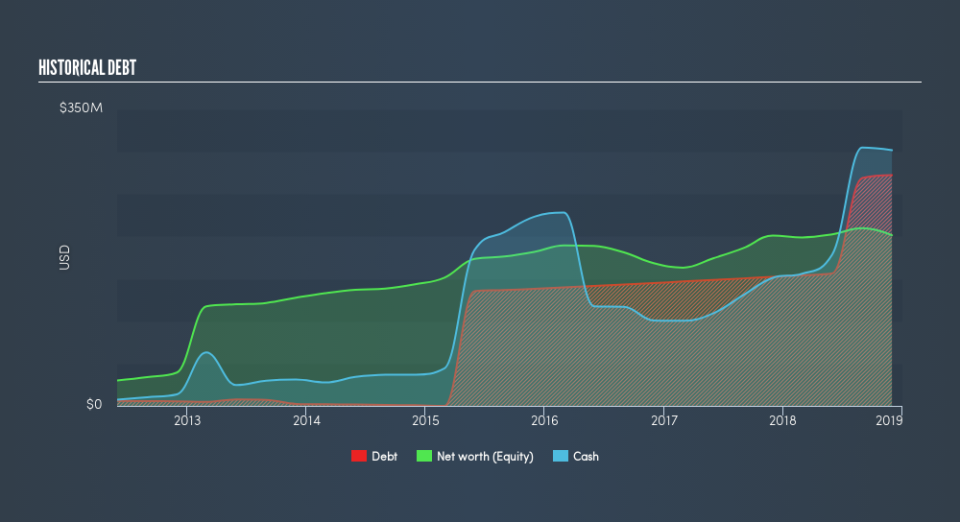
CAMP’s Debt (And Cash Flows)
CAMP's debt levels surged from US$152m to US$272m over the last 12 months , which accounts for long term debt. With this increase in debt, CAMP currently has US$302m remaining in cash and short-term investments to keep the business going. On top of this, CAMP has generated US$56m in operating cash flow during the same period of time, resulting in an operating cash to total debt ratio of 21%, indicating that CAMP’s current level of operating cash is high enough to cover debt.
Can CAMP pay its short-term liabilities?
Looking at CAMP’s US$98m in current liabilities, it seems that the business has maintained a safe level of current assets to meet its obligations, with the current ratio last standing at 4.29x. The current ratio is the number you get when you divide current assets by current liabilities. However, many consider a ratio above 3x to be high, although this is not necessarily a bad thing.
Can CAMP service its debt comfortably?
CAMP is a highly-leveraged company with debt exceeding equity by over 100%. This is somewhat unusual for small-caps companies, since lenders are often hesitant to provide attractive interest rates to less-established businesses. We can check to see whether CAMP is able to meet its debt obligations by looking at the net interest coverage ratio. A company generating earnings before interest and tax (EBIT) at least three times its net interest payments is considered financially sound. In CAMP's, case, the ratio of 1.35x suggests that interest is not strongly covered, which means that debtors may be less inclined to loan the company more money, reducing its headroom for growth through debt.
Next Steps:
CAMP’s high cash coverage means that, although its debt levels are high, the company is able to utilise its borrowings efficiently in order to generate cash flow. This may mean this is an optimal capital structure for the business, given that it is also meeting its short-term commitment. I admit this is a fairly basic analysis for CAMP's financial health. Other important fundamentals need to be considered alongside. You should continue to research CalAmp to get a more holistic view of the small-cap by looking at:
Future Outlook: What are well-informed industry analysts predicting for CAMP’s future growth? Take a look at our free research report of analyst consensus for CAMP’s outlook.
Valuation: What is CAMP worth today? Is the stock undervalued, even when its growth outlook is factored into its intrinsic value? The intrinsic value infographic in our free research report helps visualize whether CAMP is currently mispriced by the market.
Other High-Performing Stocks: Are there other stocks that provide better prospects with proven track records? Explore our free list of these great stocks here.
We aim to bring you long-term focused research analysis driven by fundamental data. Note that our analysis may not factor in the latest price-sensitive company announcements or qualitative material.
If you spot an error that warrants correction, please contact the editor at editorial-team@simplywallst.com. This article by Simply Wall St is general in nature. It does not constitute a recommendation to buy or sell any stock, and does not take account of your objectives, or your financial situation. Simply Wall St has no position in the stocks mentioned. Thank you for reading.
