
 Yahoo Finance
 Calculating The Fair Value Of Pitney Bowes Inc. (NYSE:PBI)
Key Insights
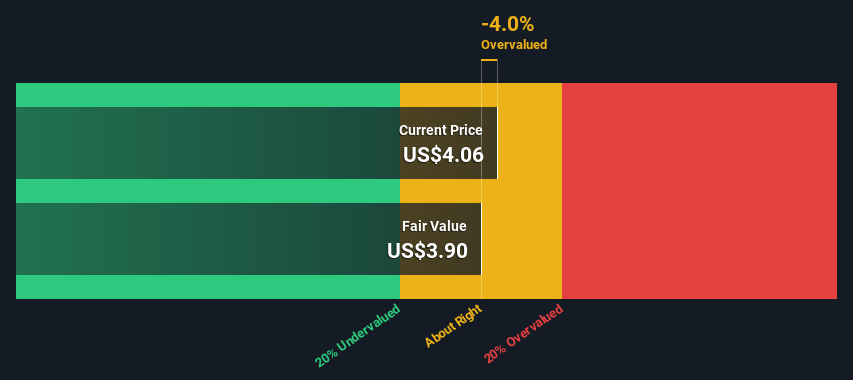
The projected fair value for Pitney Bowes is US$3.90 based on 2 Stage Free Cash Flow to Equity
Pitney Bowes' US$4.06 share price indicates it is trading at similar levels as its fair value estimate
When compared to theindustry average discount of -12%, Pitney Bowes' competitors seem to be trading at a greater premium to fair value
Today we will run through one way of estimating the intrinsic value of Pitney Bowes Inc. (NYSE:PBI) by taking the forecast future cash flows of the company and discounting them back to today's value. We will use the Discounted Cash Flow (DCF) model on this occasion. Before you think you won't be able to understand it, just read on! It's actually much less complex than you'd imagine.
We would caution that there are many ways of valuing a company and, like the DCF, each technique has advantages and disadvantages in certain scenarios. Anyone interested in learning a bit more about intrinsic value should have a read of the Simply Wall St analysis model.
See our latest analysis for Pitney Bowes
The Calculation
We are going to use a two-stage DCF model, which, as the name states, takes into account two stages of growth. The first stage is generally a higher growth period which levels off heading towards the terminal value, captured in the second 'steady growth' period. To begin with, we have to get estimates of the next ten years of cash flows. Where possible we use analyst estimates, but when these aren't available we extrapolate the previous free cash flow (FCF) from the last estimate or reported value. We assume companies with shrinking free cash flow will slow their rate of shrinkage, and that companies with growing free cash flow will see their growth rate slow, over this period. We do this to reflect that growth tends to slow more in the early years than it does in later years.
Generally we assume that a dollar today is more valuable than a dollar in the future, and so the sum of these future cash flows is then discounted to today's value:
10-year free cash flow (FCF) forecast
2024 | 2025 | 2026 | 2027 | 2028 | 2029 | 2030 | 2031 | 2032 | 2033 | |
Levered FCF ($, Millions) | US$12.1m | US$62.3m | US$68.9m | US$74.5m | US$79.3m | US$83.3m | US$86.8m | US$90.0m | US$92.9m | US$95.6m |
Growth Rate Estimate Source | Analyst x1 | Analyst x1 | Est @ 10.67% | Est @ 8.14% | Est @ 6.36% | Est @ 5.12% | Est @ 4.25% | Est @ 3.64% | Est @ 3.21% | Est @ 2.92% |
Present Value ($, Millions) Discounted @ 12% | US$10.7 | US$49.4 | US$48.8 | US$47.0 | US$44.5 | US$41.7 | US$38.7 | US$35.8 | US$32.9 | US$30.2 |
("Est" = FCF growth rate estimated by Simply Wall St)
Present Value of 10-year Cash Flow (PVCF) = US$380m
The second stage is also known as Terminal Value, this is the business's cash flow after the first stage. The Gordon Growth formula is used to calculate Terminal Value at a future annual growth rate equal to the 5-year average of the 10-year government bond yield of 2.2%. We discount the terminal cash flows to today's value at a cost of equity of 12%.
Terminal Value (TV)= FCF2033 × (1 + g) ÷ (r – g) = US$96m× (1 + 2.2%) ÷ (12%– 2.2%) = US$977m
Present Value of Terminal Value (PVTV)= TV / (1 + r)10= US$977m÷ ( 1 + 12%)10= US$309m
The total value, or equity value, is then the sum of the present value of the future cash flows, which in this case is US$688m. The last step is to then divide the equity value by the number of shares outstanding. Compared to the current share price of US$4.1, the company appears around fair value at the time of writing. Valuations are imprecise instruments though, rather like a telescope - move a few degrees and end up in a different galaxy. Do keep this in mind.
Important Assumptions
We would point out that the most important inputs to a discounted cash flow are the discount rate and of course the actual cash flows. Part of investing is coming up with your own evaluation of a company's future performance, so try the calculation yourself and check your own assumptions. The DCF also does not consider the possible cyclicality of an industry, or a company's future capital requirements, so it does not give a full picture of a company's potential performance. Given that we are looking at Pitney Bowes as potential shareholders, the cost of equity is used as the discount rate, rather than the cost of capital (or weighted average cost of capital, WACC) which accounts for debt. In this calculation we've used 12%, which is based on a levered beta of 2.000. Beta is a measure of a stock's volatility, compared to the market as a whole. We get our beta from the industry average beta of globally comparable companies, with an imposed limit between 0.8 and 2.0, which is a reasonable range for a stable business.
SWOT Analysis for Pitney Bowes
Strength
Dividend is in the top 25% of dividend payers in the market.
Weakness
Interest payments on debt are not well covered.
Opportunity
Expected to breakeven next year.
Has sufficient cash runway for more than 3 years based on current free cash flows.
Good value based on P/S ratio compared to estimated Fair P/S ratio.
Threat
Debt is not well covered by operating cash flow.
Total liabilities exceed total assets, which raises the risk of financial distress.
Paying a dividend but company is unprofitable.
Next Steps:
Whilst important, the DCF calculation ideally won't be the sole piece of analysis you scrutinize for a company. DCF models are not the be-all and end-all of investment valuation. Instead the best use for a DCF model is to test certain assumptions and theories to see if they would lead to the company being undervalued or overvalued. For instance, if the terminal value growth rate is adjusted slightly, it can dramatically alter the overall result. For Pitney Bowes, we've compiled three essential aspects you should consider:
Risks: Case in point, we've spotted 2 warning signs for Pitney Bowes you should be aware of, and 1 of them can't be ignored.
Future Earnings: How does PBI's growth rate compare to its peers and the wider market? Dig deeper into the analyst consensus number for the upcoming years by interacting with our free analyst growth expectation chart.
Other Solid Businesses: Low debt, high returns on equity and good past performance are fundamental to a strong business. Why not explore our interactive list of stocks with solid business fundamentals to see if there are other companies you may not have considered!
PS. The Simply Wall St app conducts a discounted cash flow valuation for every stock on the NYSE every day. If you want to find the calculation for other stocks just search here.
Have feedback on this article? Concerned about the content? Get in touch with us directly. Alternatively, email editorial-team (at) simplywallst.com.
This article by Simply Wall St is general in nature. We provide commentary based on historical data and analyst forecasts only using an unbiased methodology and our articles are not intended to be financial advice. It does not constitute a recommendation to buy or sell any stock, and does not take account of your objectives, or your financial situation. We aim to bring you long-term focused analysis driven by fundamental data. Note that our analysis may not factor in the latest price-sensitive company announcements or qualitative material. Simply Wall St has no position in any stocks mentioned.
