
 Yahoo Finance
 Calculating The Fair Value Of SBM Offshore N.V. (AMS:SBMO)
Key Insights
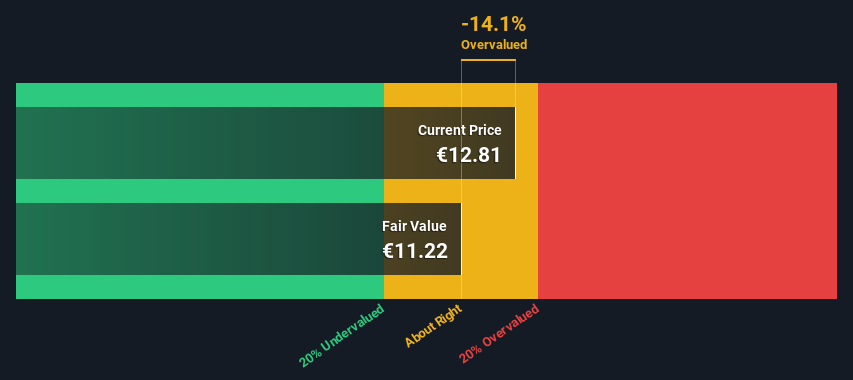
The projected fair value for SBM Offshore is €11.22 based on Dividend Discount Model
With €12.81 share price, SBM Offshore appears to be trading close to its estimated fair value
The US$19.98 analyst price target for SBMO is 78% more than our estimate of fair value
Today we will run through one way of estimating the intrinsic value of SBM Offshore N.V. (AMS:SBMO) by taking the expected future cash flows and discounting them to today's value. The Discounted Cash Flow (DCF) model is the tool we will apply to do this. Before you think you won't be able to understand it, just read on! It's actually much less complex than you'd imagine.
We generally believe that a company's value is the present value of all of the cash it will generate in the future. However, a DCF is just one valuation metric among many, and it is not without flaws. Anyone interested in learning a bit more about intrinsic value should have a read of the Simply Wall St analysis model.
Check out our latest analysis for SBM Offshore
Crunching The Numbers
We have to calculate the value of SBM Offshore slightly differently to other stocks because it is a energy services company. In this approach dividends per share (DPS) are used, as free cash flow is difficult to estimate and often not reported by analysts. This often underestimates the value of a stock, but it can still be good as a comparison to competitors. We use the Gordon Growth Model, which assumes dividend will grow into perpetuity at a rate that can be sustained. For a number of reasons a very conservative growth rate is used that cannot exceed that of a company's Gross Domestic Product (GDP). In this case we used the 5-year average of the 10-year government bond yield (0.3%). The expected dividend per share is then discounted to today's value at a cost of equity of 12%. Relative to the current share price of €12.8, the company appears around fair value at the time of writing. Valuations are imprecise instruments though, rather like a telescope - move a few degrees and end up in a different galaxy. Do keep this in mind.
Value Per Share = Expected Dividend Per Share / (Discount Rate - Perpetual Growth Rate)
= US$1.4 / (12% – 0.3%)
= €11.2
Important Assumptions
We would point out that the most important inputs to a discounted cash flow are the discount rate and of course the actual cash flows. Part of investing is coming up with your own evaluation of a company's future performance, so try the calculation yourself and check your own assumptions. The DCF also does not consider the possible cyclicality of an industry, or a company's future capital requirements, so it does not give a full picture of a company's potential performance. Given that we are looking at SBM Offshore as potential shareholders, the cost of equity is used as the discount rate, rather than the cost of capital (or weighted average cost of capital, WACC) which accounts for debt. In this calculation we've used 12%, which is based on a levered beta of 1.890. Beta is a measure of a stock's volatility, compared to the market as a whole. We get our beta from the industry average beta of globally comparable companies, with an imposed limit between 0.8 and 2.0, which is a reasonable range for a stable business.
SWOT Analysis for SBM Offshore
Strength
Debt is well covered by .
Dividend is in the top 25% of dividend payers in the market.
Weakness
Earnings growth over the past year underperformed the Energy Services industry.
Interest payments on debt are not well covered.
Current share price is above our estimate of fair value.
Opportunity
SBMO's financial characteristics indicate limited near-term opportunities for shareholders.
Threat
Debt is not well covered by operating cash flow.
Paying a dividend but company has no free cash flows.
Annual earnings are forecast to decline for the next 3 years.
Moving On:
Whilst important, the DCF calculation shouldn't be the only metric you look at when researching a company. The DCF model is not a perfect stock valuation tool. Instead the best use for a DCF model is to test certain assumptions and theories to see if they would lead to the company being undervalued or overvalued. For example, changes in the company's cost of equity or the risk free rate can significantly impact the valuation. For SBM Offshore, there are three pertinent factors you should further research:
Risks: Take risks, for example - SBM Offshore has 3 warning signs (and 2 which make us uncomfortable) we think you should know about.
Future Earnings: How does SBMO's growth rate compare to its peers and the wider market? Dig deeper into the analyst consensus number for the upcoming years by interacting with our free analyst growth expectation chart.
Other Solid Businesses: Low debt, high returns on equity and good past performance are fundamental to a strong business. Why not explore our interactive list of stocks with solid business fundamentals to see if there are other companies you may not have considered!
PS. The Simply Wall St app conducts a discounted cash flow valuation for every stock on the ENXTAM every day. If you want to find the calculation for other stocks just search here.
Have feedback on this article? Concerned about the content? Get in touch with us directly. Alternatively, email editorial-team (at) simplywallst.com.
This article by Simply Wall St is general in nature. We provide commentary based on historical data and analyst forecasts only using an unbiased methodology and our articles are not intended to be financial advice. It does not constitute a recommendation to buy or sell any stock, and does not take account of your objectives, or your financial situation. We aim to bring you long-term focused analysis driven by fundamental data. Note that our analysis may not factor in the latest price-sensitive company announcements or qualitative material. Simply Wall St has no position in any stocks mentioned.
Join A Paid User Research Session
You’ll receive a US$30 Amazon Gift card for 1 hour of your time while helping us build better investing tools for the individual investors like yourself. Sign up here
