
 Yahoo Finance
 Calculating The Intrinsic Value Of Dewhurst Group Plc (LON:DWHT)
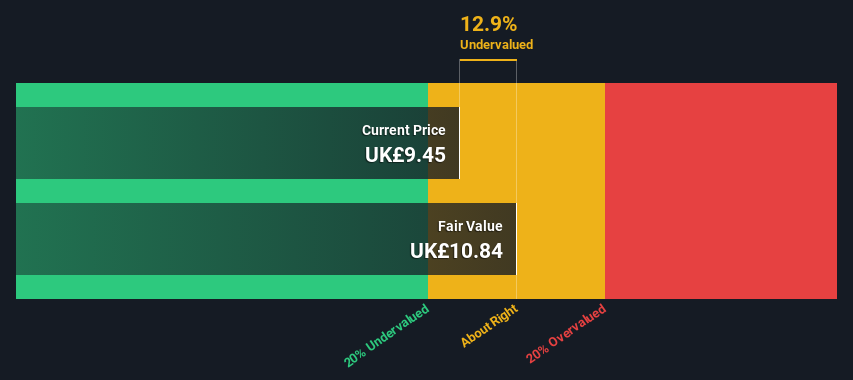
Key Insights
Using the 2 Stage Free Cash Flow to Equity, Dewhurst Group fair value estimate is UK£10.84
Current share price of UK£9.45 suggests Dewhurst Group is potentially trading close to its fair value
Dewhurst Group's peers are currently trading at a premium of 48% on average
In this article we are going to estimate the intrinsic value of Dewhurst Group Plc (LON:DWHT) by projecting its future cash flows and then discounting them to today's value. One way to achieve this is by employing the Discounted Cash Flow (DCF) model. There's really not all that much to it, even though it might appear quite complex.
Remember though, that there are many ways to estimate a company's value, and a DCF is just one method. If you still have some burning questions about this type of valuation, take a look at the Simply Wall St analysis model.
See our latest analysis for Dewhurst Group
The Method
We're using the 2-stage growth model, which simply means we take in account two stages of company's growth. In the initial period the company may have a higher growth rate and the second stage is usually assumed to have a stable growth rate. To start off with, we need to estimate the next ten years of cash flows. Seeing as no analyst estimates of free cash flow are available to us, we have extrapolate the previous free cash flow (FCF) from the company's last reported value. We assume companies with shrinking free cash flow will slow their rate of shrinkage, and that companies with growing free cash flow will see their growth rate slow, over this period. We do this to reflect that growth tends to slow more in the early years than it does in later years.
Generally we assume that a dollar today is more valuable than a dollar in the future, so we need to discount the sum of these future cash flows to arrive at a present value estimate:
10-year free cash flow (FCF) forecast
2024 | 2025 | 2026 | 2027 | 2028 | 2029 | 2030 | 2031 | 2032 | 2033 | |
Levered FCF (£, Millions) | UK£5.26m | UK£5.60m | UK£5.89m | UK£6.12m | UK£6.33m | UK£6.51m | UK£6.67m | UK£6.81m | UK£6.95m | UK£7.09m |
Growth Rate Estimate Source | Est @ 8.61% | Est @ 6.52% | Est @ 5.06% | Est @ 4.03% | Est @ 3.31% | Est @ 2.81% | Est @ 2.46% | Est @ 2.21% | Est @ 2.04% | Est @ 1.92% |
Present Value (£, Millions) Discounted @ 7.9% | UK£4.9 | UK£4.8 | UK£4.7 | UK£4.5 | UK£4.3 | UK£4.1 | UK£3.9 | UK£3.7 | UK£3.5 | UK£3.3 |
("Est" = FCF growth rate estimated by Simply Wall St)
Present Value of 10-year Cash Flow (PVCF) = UK£42m
After calculating the present value of future cash flows in the initial 10-year period, we need to calculate the Terminal Value, which accounts for all future cash flows beyond the first stage. For a number of reasons a very conservative growth rate is used that cannot exceed that of a country's GDP growth. In this case we have used the 5-year average of the 10-year government bond yield (1.6%) to estimate future growth. In the same way as with the 10-year 'growth' period, we discount future cash flows to today's value, using a cost of equity of 7.9%.
Terminal Value (TV)= FCF2033 × (1 + g) ÷ (r – g) = UK£7.1m× (1 + 1.6%) ÷ (7.9%– 1.6%) = UK£116m
Present Value of Terminal Value (PVTV)= TV / (1 + r)10= UK£116m÷ ( 1 + 7.9%)10= UK£54m
The total value, or equity value, is then the sum of the present value of the future cash flows, which in this case is UK£96m. To get the intrinsic value per share, we divide this by the total number of shares outstanding. Relative to the current share price of UK£9.5, the company appears about fair value at a 13% discount to where the stock price trades currently. The assumptions in any calculation have a big impact on the valuation, so it is better to view this as a rough estimate, not precise down to the last cent.
Important Assumptions
Now the most important inputs to a discounted cash flow are the discount rate, and of course, the actual cash flows. You don't have to agree with these inputs, I recommend redoing the calculations yourself and playing with them. The DCF also does not consider the possible cyclicality of an industry, or a company's future capital requirements, so it does not give a full picture of a company's potential performance. Given that we are looking at Dewhurst Group as potential shareholders, the cost of equity is used as the discount rate, rather than the cost of capital (or weighted average cost of capital, WACC) which accounts for debt. In this calculation we've used 7.9%, which is based on a levered beta of 1.136. Beta is a measure of a stock's volatility, compared to the market as a whole. We get our beta from the industry average beta of globally comparable companies, with an imposed limit between 0.8 and 2.0, which is a reasonable range for a stable business.
SWOT Analysis for Dewhurst Group
Strength
Currently debt free.
Dividends are covered by earnings and cash flows.
Weakness
Earnings growth over the past year underperformed the Electrical industry.
Dividend is low compared to the top 25% of dividend payers in the Electrical market.
Shareholders have been diluted in the past year.
Opportunity
Current share price is below our estimate of fair value.
Lack of analyst coverage makes it difficult to determine DWHT's earnings prospects.
Threat
No apparent threats visible for DWHT.
Looking Ahead:
Although the valuation of a company is important, it shouldn't be the only metric you look at when researching a company. DCF models are not the be-all and end-all of investment valuation. Preferably you'd apply different cases and assumptions and see how they would impact the company's valuation. For instance, if the terminal value growth rate is adjusted slightly, it can dramatically alter the overall result. For Dewhurst Group, we've put together three essential factors you should explore:
Risks: Consider for instance, the ever-present spectre of investment risk. We've identified 2 warning signs with Dewhurst Group , and understanding them should be part of your investment process.
Other High Quality Alternatives: Do you like a good all-rounder? Explore our interactive list of high quality stocks to get an idea of what else is out there you may be missing!
Other Environmentally-Friendly Companies: Concerned about the environment and think consumers will buy eco-friendly products more and more? Browse through our interactive list of companies that are thinking about a greener future to discover some stocks you may not have thought of!
PS. The Simply Wall St app conducts a discounted cash flow valuation for every stock on the AIM every day. If you want to find the calculation for other stocks just search here.
Have feedback on this article? Concerned about the content? Get in touch with us directly. Alternatively, email editorial-team (at) simplywallst.com.
This article by Simply Wall St is general in nature. We provide commentary based on historical data and analyst forecasts only using an unbiased methodology and our articles are not intended to be financial advice. It does not constitute a recommendation to buy or sell any stock, and does not take account of your objectives, or your financial situation. We aim to bring you long-term focused analysis driven by fundamental data. Note that our analysis may not factor in the latest price-sensitive company announcements or qualitative material. Simply Wall St has no position in any stocks mentioned.
