
 Yahoo Finance
 What Is Callon Petroleum's (NYSE:CPE) P/E Ratio After Its Share Price Rocketed?

Callon Petroleum (NYSE:CPE) shareholders are no doubt pleased to see that the share price has had a great month, posting a 32% gain, recovering from prior weakness. But shareholders may not all be feeling jubilant, since the share price is still down 26% in the last year.
Assuming no other changes, a sharply higher share price makes a stock less attractive to potential buyers. In the long term, share prices tend to follow earnings per share, but in the short term prices bounce around in response to short term factors (which are not always obvious). The implication here is that deep value investors might steer clear when expectations of a company are too high. One way to gauge market expectations of a stock is to look at its Price to Earnings Ratio (PE Ratio). A high P/E implies that investors have high expectations of what a company can achieve compared to a company with a low P/E ratio.
View our latest analysis for Callon Petroleum
Does Callon Petroleum Have A Relatively High Or Low P/E For Its Industry?
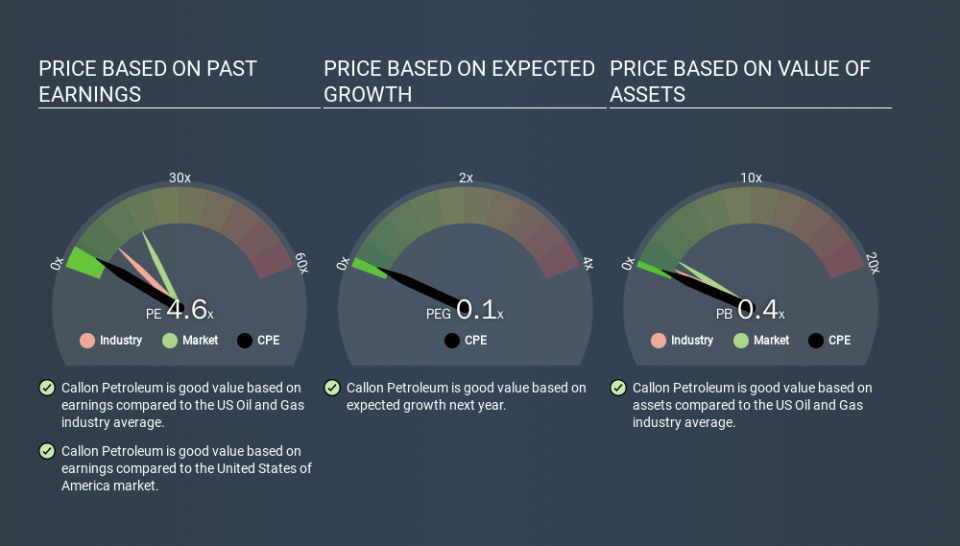
Callon Petroleum's P/E of 4.70 indicates relatively low sentiment towards the stock. If you look at the image below, you can see Callon Petroleum has a lower P/E than the average (10.5) in the oil and gas industry classification.
Its relatively low P/E ratio indicates that Callon Petroleum shareholders think it will struggle to do as well as other companies in its industry classification. While current expectations are low, the stock could be undervalued if the situation is better than the market assumes. If you consider the stock interesting, further research is recommended. For example, I often monitor director buying and selling.
How Growth Rates Impact P/E Ratios
Earnings growth rates have a big influence on P/E ratios. Earnings growth means that in the future the 'E' will be higher. Therefore, even if you pay a high multiple of earnings now, that multiple will become lower in the future. So while a stock may look expensive based on past earnings, it could be cheap based on future earnings.
Notably, Callon Petroleum grew EPS by a whopping 35% in the last year. And it has bolstered its earnings per share by 24% per year over the last five years. So we'd generally expect it to have a relatively high P/E ratio.
A Limitation: P/E Ratios Ignore Debt and Cash In The Bank
Don't forget that the P/E ratio considers market capitalization. Thus, the metric does not reflect cash or debt held by the company. In theory, a company can lower its future P/E ratio by using cash or debt to invest in growth.
Such spending might be good or bad, overall, but the key point here is that you need to look at debt to understand the P/E ratio in context.
Callon Petroleum's Balance Sheet
Net debt totals a substantial 110% of Callon Petroleum's market cap. If you want to compare its P/E ratio to other companies, you must keep in mind that these debt levels would usually warrant a relatively low P/E.
The Verdict On Callon Petroleum's P/E Ratio
Callon Petroleum trades on a P/E ratio of 4.7, which is below the US market average of 18.9. While the EPS growth last year was strong, the significant debt levels reduce the number of options available to management. The low P/E ratio suggests current market expectations are muted, implying these levels of growth will not continue. What we know for sure is that investors are becoming less uncomfortable about Callon Petroleum's prospects, since they have pushed its P/E ratio from 3.6 to 4.7 over the last month. If you like to buy stocks that could be turnaround opportunities, then this one might be a candidate; but if you're more sensitive to price, then you may feel the opportunity has passed.
When the market is wrong about a stock, it gives savvy investors an opportunity. If the reality for a company is not as bad as the P/E ratio indicates, then the share price should increase as the market realizes this. So this free visual report on analyst forecasts could hold the key to an excellent investment decision.
You might be able to find a better buy than Callon Petroleum. If you want a selection of possible winners, check out this free list of interesting companies that trade on a P/E below 20 (but have proven they can grow earnings).
If you spot an error that warrants correction, please contact the editor at editorial-team@simplywallst.com. This article by Simply Wall St is general in nature. It does not constitute a recommendation to buy or sell any stock, and does not take account of your objectives, or your financial situation. Simply Wall St has no position in the stocks mentioned.
We aim to bring you long-term focused research analysis driven by fundamental data. Note that our analysis may not factor in the latest price-sensitive company announcements or qualitative material. Thank you for reading.
