
 Yahoo Finance
 Calumet Specialty Products Partners (NASDAQ:CLMT) Shareholders Will Want The ROCE Trajectory To Continue
If you're looking for a multi-bagger, there's a few things to keep an eye out for. In a perfect world, we'd like to see a company investing more capital into its business and ideally the returns earned from that capital are also increasing. Ultimately, this demonstrates that it's a business that is reinvesting profits at increasing rates of return. So when we looked at Calumet Specialty Products Partners (NASDAQ:CLMT) and its trend of ROCE, we really liked what we saw.
What Is Return On Capital Employed (ROCE)?
If you haven't worked with ROCE before, it measures the 'return' (pre-tax profit) a company generates from capital employed in its business. The formula for this calculation on Calumet Specialty Products Partners is:
Return on Capital Employed = Earnings Before Interest and Tax (EBIT) ÷ (Total Assets - Current Liabilities)
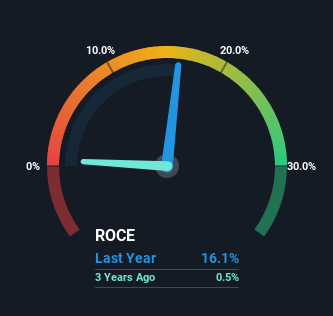
0.16 = US$263m ÷ (US$2.8b - US$1.1b) (Based on the trailing twelve months to December 2023).
So, Calumet Specialty Products Partners has an ROCE of 16%. That's a relatively normal return on capital, and it's around the 14% generated by the Oil and Gas industry.
Check out our latest analysis for Calumet Specialty Products Partners
Above you can see how the current ROCE for Calumet Specialty Products Partners compares to its prior returns on capital, but there's only so much you can tell from the past. If you'd like, you can check out the forecasts from the analysts covering Calumet Specialty Products Partners for free.
What Can We Tell From Calumet Specialty Products Partners' ROCE Trend?
Calumet Specialty Products Partners' ROCE growth is quite impressive. The figures show that over the last five years, ROCE has grown 47% whilst employing roughly the same amount of capital. So our take on this is that the business has increased efficiencies to generate these higher returns, all the while not needing to make any additional investments. It's worth looking deeper into this though because while it's great that the business is more efficient, it might also mean that going forward the areas to invest internally for the organic growth are lacking.
For the record though, there was a noticeable increase in the company's current liabilities over the period, so we would attribute some of the ROCE growth to that. The current liabilities has increased to 40% of total assets, so the business is now more funded by the likes of its suppliers or short-term creditors. And with current liabilities at those levels, that's pretty high.
The Bottom Line On Calumet Specialty Products Partners' ROCE
To bring it all together, Calumet Specialty Products Partners has done well to increase the returns it's generating from its capital employed. And a remarkable 325% total return over the last five years tells us that investors are expecting more good things to come in the future. With that being said, we still think the promising fundamentals mean the company deserves some further due diligence.
One more thing: We've identified 3 warning signs with Calumet Specialty Products Partners (at least 2 which can't be ignored) , and understanding these would certainly be useful.
While Calumet Specialty Products Partners may not currently earn the highest returns, we've compiled a list of companies that currently earn more than 25% return on equity. Check out this free list here.
Have feedback on this article? Concerned about the content? Get in touch with us directly. Alternatively, email editorial-team (at) simplywallst.com.
This article by Simply Wall St is general in nature. We provide commentary based on historical data and analyst forecasts only using an unbiased methodology and our articles are not intended to be financial advice. It does not constitute a recommendation to buy or sell any stock, and does not take account of your objectives, or your financial situation. We aim to bring you long-term focused analysis driven by fundamental data. Note that our analysis may not factor in the latest price-sensitive company announcements or qualitative material. Simply Wall St has no position in any stocks mentioned.
