
 Yahoo Finance
 Capital Allocation Trends At Aerison Group (ASX:AE1) Aren't Ideal
To find a multi-bagger stock, what are the underlying trends we should look for in a business? One common approach is to try and find a company with returns on capital employed (ROCE) that are increasing, in conjunction with a growing amount of capital employed. This shows us that it's a compounding machine, able to continually reinvest its earnings back into the business and generate higher returns. So while Aerison Group (ASX:AE1) has a high ROCE right now, lets see what we can decipher from how returns are changing.
Return On Capital Employed (ROCE): What Is It?
Just to clarify if you're unsure, ROCE is a metric for evaluating how much pre-tax income (in percentage terms) a company earns on the capital invested in its business. The formula for this calculation on Aerison Group is:
Return on Capital Employed = Earnings Before Interest and Tax (EBIT) ÷ (Total Assets - Current Liabilities)
0.24 = AU$9.1m ÷ (AU$85m - AU$47m) (Based on the trailing twelve months to December 2021).
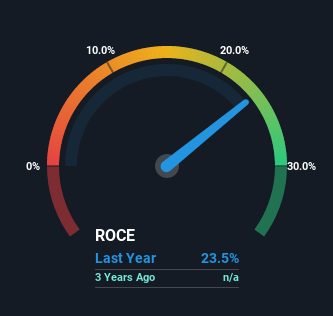
Thus, Aerison Group has an ROCE of 24%. That's a fantastic return and not only that, it outpaces the average of 14% earned by companies in a similar industry.
Check out our latest analysis for Aerison Group
While the past is not representative of the future, it can be helpful to know how a company has performed historically, which is why we have this chart above. If you're interested in investigating Aerison Group's past further, check out this free graph of past earnings, revenue and cash flow.
How Are Returns Trending?
On the surface, the trend of ROCE at Aerison Group doesn't inspire confidence. While it's comforting that the ROCE is high, two years ago it was 53%. Although, given both revenue and the amount of assets employed in the business have increased, it could suggest the company is investing in growth, and the extra capital has led to a short-term reduction in ROCE. And if the increased capital generates additional returns, the business, and thus shareholders, will benefit in the long run.
On a side note, Aerison Group has done well to pay down its current liabilities to 55% of total assets. That could partly explain why the ROCE has dropped. What's more, this can reduce some aspects of risk to the business because now the company's suppliers or short-term creditors are funding less of its operations. Since the business is basically funding more of its operations with it's own money, you could argue this has made the business less efficient at generating ROCE. Either way, they're still at a pretty high level, so we'd like to see them fall further if possible.
What We Can Learn From Aerison Group's ROCE
In summary, despite lower returns in the short term, we're encouraged to see that Aerison Group is reinvesting for growth and has higher sales as a result. And there could be an opportunity here if other metrics look good too, because the stock has declined 41% in the last year. As a result, we'd recommend researching this stock further to uncover what other fundamentals of the business can show us.
Aerison Group does come with some risks though, we found 3 warning signs in our investment analysis, and 1 of those is a bit concerning...
High returns are a key ingredient to strong performance, so check out our free list ofstocks earning high returns on equity with solid balance sheets.
Have feedback on this article? Concerned about the content? Get in touch with us directly. Alternatively, email editorial-team (at) simplywallst.com.
This article by Simply Wall St is general in nature. We provide commentary based on historical data and analyst forecasts only using an unbiased methodology and our articles are not intended to be financial advice. It does not constitute a recommendation to buy or sell any stock, and does not take account of your objectives, or your financial situation. We aim to bring you long-term focused analysis driven by fundamental data. Note that our analysis may not factor in the latest price-sensitive company announcements or qualitative material. Simply Wall St has no position in any stocks mentioned.
Join A Paid User Research Session
You’ll receive a US$30 Amazon Gift card for 1 hour of your time while helping us build better investing tools for the individual investors like yourself. Sign up here
