
 Yahoo Finance
 Capital Allocation Trends At Brooge Energy (NASDAQ:BROG) Aren't Ideal
If we want to find a potential multi-bagger, often there are underlying trends that can provide clues. Ideally, a business will show two trends; firstly a growing return on capital employed (ROCE) and secondly, an increasing amount of capital employed. Put simply, these types of businesses are compounding machines, meaning they are continually reinvesting their earnings at ever-higher rates of return. In light of that, when we looked at Brooge Energy (NASDAQ:BROG) and its ROCE trend, we weren't exactly thrilled.
What is Return On Capital Employed (ROCE)?
If you haven't worked with ROCE before, it measures the 'return' (pre-tax profit) a company generates from capital employed in its business. Analysts use this formula to calculate it for Brooge Energy:
Return on Capital Employed = Earnings Before Interest and Tax (EBIT) ÷ (Total Assets - Current Liabilities)
0.052 = US$21m ÷ (US$455m - US$60m) (Based on the trailing twelve months to June 2021).
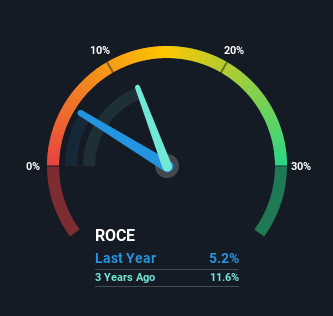
So, Brooge Energy has an ROCE of 5.2%. Ultimately, that's a low return and it under-performs the Oil and Gas industry average of 9.1%.
View our latest analysis for Brooge Energy
In the above chart we have measured Brooge Energy's prior ROCE against its prior performance, but the future is arguably more important. If you'd like to see what analysts are forecasting going forward, you should check out our free report for Brooge Energy.
What The Trend Of ROCE Can Tell Us
In terms of Brooge Energy's historical ROCE movements, the trend isn't fantastic. To be more specific, ROCE has fallen from 12% over the last three years. On the other hand, the company has been employing more capital without a corresponding improvement in sales in the last year, which could suggest these investments are longer term plays. It's worth keeping an eye on the company's earnings from here on to see if these investments do end up contributing to the bottom line.
On a related note, Brooge Energy has decreased its current liabilities to 13% of total assets. That could partly explain why the ROCE has dropped. What's more, this can reduce some aspects of risk to the business because now the company's suppliers or short-term creditors are funding less of its operations. Some would claim this reduces the business' efficiency at generating ROCE since it is now funding more of the operations with its own money.
The Bottom Line
To conclude, we've found that Brooge Energy is reinvesting in the business, but returns have been falling. And in the last year, the stock has given away 30% so the market doesn't look too hopeful on these trends strengthening any time soon. On the whole, we aren't too inspired by the underlying trends and we think there may be better chances of finding a multi-bagger elsewhere.
If you want to know some of the risks facing Brooge Energy we've found 3 warning signs (2 shouldn't be ignored!) that you should be aware of before investing here.
While Brooge Energy isn't earning the highest return, check out this free list of companies that are earning high returns on equity with solid balance sheets.
Have feedback on this article? Concerned about the content? Get in touch with us directly. Alternatively, email editorial-team (at) simplywallst.com.
This article by Simply Wall St is general in nature. We provide commentary based on historical data and analyst forecasts only using an unbiased methodology and our articles are not intended to be financial advice. It does not constitute a recommendation to buy or sell any stock, and does not take account of your objectives, or your financial situation. We aim to bring you long-term focused analysis driven by fundamental data. Note that our analysis may not factor in the latest price-sensitive company announcements or qualitative material. Simply Wall St has no position in any stocks mentioned.