
 Yahoo Finance
 Capital Allocation Trends At Centamin (LON:CEY) Aren't Ideal
To avoid investing in a business that's in decline, there's a few financial metrics that can provide early indications of aging. When we see a declining return on capital employed (ROCE) in conjunction with a declining base of capital employed, that's often how a mature business shows signs of aging. This indicates the company is producing less profit from its investments and its total assets are decreasing. So after we looked into Centamin (LON:CEY), the trends above didn't look too great.
Return On Capital Employed (ROCE): What Is It?
Just to clarify if you're unsure, ROCE is a metric for evaluating how much pre-tax income (in percentage terms) a company earns on the capital invested in its business. To calculate this metric for Centamin, this is the formula:
Return on Capital Employed = Earnings Before Interest and Tax (EBIT) ÷ (Total Assets - Current Liabilities)
0.14 = US$193m ÷ (US$1.5b - US$84m) (Based on the trailing twelve months to June 2023).
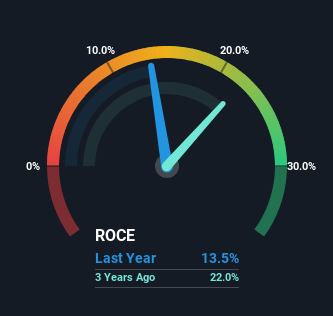
Thus, Centamin has an ROCE of 14%. On its own, that's a standard return, however it's much better than the 7.8% generated by the Metals and Mining industry.
Check out our latest analysis for Centamin
In the above chart we have measured Centamin's prior ROCE against its prior performance, but the future is arguably more important. If you're interested, you can view the analysts predictions in our free analyst report for Centamin .
What Can We Tell From Centamin's ROCE Trend?
In terms of Centamin's historical ROCE movements, the trend doesn't inspire confidence. About five years ago, returns on capital were 20%, however they're now substantially lower than that as we saw above. Meanwhile, capital employed in the business has stayed roughly the flat over the period. Companies that exhibit these attributes tend to not be shrinking, but they can be mature and facing pressure on their margins from competition. So because these trends aren't typically conducive to creating a multi-bagger, we wouldn't hold our breath on Centamin becoming one if things continue as they have.
In Conclusion...
All in all, the lower returns from the same amount of capital employed aren't exactly signs of a compounding machine. But investors must be expecting an improvement of sorts because over the last five yearsthe stock has delivered a respectable 50% return. In any case, the current underlying trends don't bode well for long term performance so unless they reverse, we'd start looking elsewhere.
One more thing to note, we've identified 2 warning signs with Centamin and understanding these should be part of your investment process.
If you want to search for solid companies with great earnings, check out this free list of companies with good balance sheets and impressive returns on equity.
Have feedback on this article? Concerned about the content? Get in touch with us directly. Alternatively, email editorial-team (at) simplywallst.com.
This article by Simply Wall St is general in nature. We provide commentary based on historical data and analyst forecasts only using an unbiased methodology and our articles are not intended to be financial advice. It does not constitute a recommendation to buy or sell any stock, and does not take account of your objectives, or your financial situation. We aim to bring you long-term focused analysis driven by fundamental data. Note that our analysis may not factor in the latest price-sensitive company announcements or qualitative material. Simply Wall St has no position in any stocks mentioned.
