
 Yahoo Finance
 Capital Allocation Trends At OPG Power Ventures (LON:OPG) Aren't Ideal
What financial metrics can indicate to us that a company is maturing or even in decline? When we see a declining return on capital employed (ROCE) in conjunction with a declining base of capital employed, that's often how a mature business shows signs of aging. Trends like this ultimately mean the business is reducing its investments and also earning less on what it has invested. In light of that, from a first glance at OPG Power Ventures (LON:OPG), we've spotted some signs that it could be struggling, so let's investigate.
Understanding Return On Capital Employed (ROCE)
For those who don't know, ROCE is a measure of a company's yearly pre-tax profit (its return), relative to the capital employed in the business. Analysts use this formula to calculate it for OPG Power Ventures:
Return on Capital Employed = Earnings Before Interest and Tax (EBIT) ÷ (Total Assets - Current Liabilities)
0.09 = UK£20m ÷ (UK£274m - UK£52m) (Based on the trailing twelve months to September 2021).
So, OPG Power Ventures has an ROCE of 9.0%. On its own, that's a low figure but it's around the 8.5% average generated by the Electric Utilities industry.
Check out our latest analysis for OPG Power Ventures
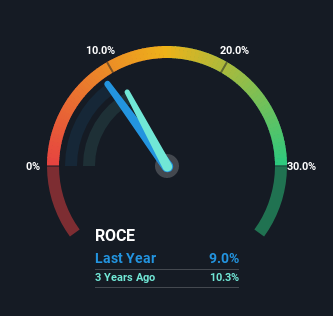
Historical performance is a great place to start when researching a stock so above you can see the gauge for OPG Power Ventures' ROCE against it's prior returns. If you want to delve into the historical earnings, revenue and cash flow of OPG Power Ventures, check out these free graphs here.
What Can We Tell From OPG Power Ventures' ROCE Trend?
We are a bit anxious about the trends of ROCE at OPG Power Ventures. To be more specific, today's ROCE was 13% five years ago but has since fallen to 9.0%. On top of that, the business is utilizing 53% less capital within its operations. When you see both ROCE and capital employed diminishing, it can often be a sign of a mature and shrinking business that might be in structural decline. If these underlying trends continue, we wouldn't be too optimistic going forward.
The Bottom Line On OPG Power Ventures' ROCE
In short, lower returns and decreasing amounts capital employed in the business doesn't fill us with confidence. This could explain why the stock has sunk a total of 81% in the last five years. That being the case, unless the underlying trends revert to a more positive trajectory, we'd consider looking elsewhere.
If you'd like to know more about OPG Power Ventures, we've spotted 4 warning signs, and 1 of them is a bit unpleasant.
While OPG Power Ventures isn't earning the highest return, check out this free list of companies that are earning high returns on equity with solid balance sheets.
Have feedback on this article? Concerned about the content? Get in touch with us directly. Alternatively, email editorial-team (at) simplywallst.com.
This article by Simply Wall St is general in nature. We provide commentary based on historical data and analyst forecasts only using an unbiased methodology and our articles are not intended to be financial advice. It does not constitute a recommendation to buy or sell any stock, and does not take account of your objectives, or your financial situation. We aim to bring you long-term focused analysis driven by fundamental data. Note that our analysis may not factor in the latest price-sensitive company announcements or qualitative material. Simply Wall St has no position in any stocks mentioned.
Join A Paid User Research Session
You’ll receive a US$30 Amazon Gift card for 1 hour of your time while helping us build better investing tools for the individual investors like yourself. Sign up here
