
 Yahoo Finance
 Capital Investment Trends At Lennox International (NYSE:LII) Look Strong
To find a multi-bagger stock, what are the underlying trends we should look for in a business? Firstly, we'll want to see a proven return on capital employed (ROCE) that is increasing, and secondly, an expanding base of capital employed. This shows us that it's a compounding machine, able to continually reinvest its earnings back into the business and generate higher returns. Ergo, when we looked at the ROCE trends at Lennox International (NYSE:LII), we liked what we saw.
Return On Capital Employed (ROCE): What Is It?
Just to clarify if you're unsure, ROCE is a metric for evaluating how much pre-tax income (in percentage terms) a company earns on the capital invested in its business. To calculate this metric for Lennox International, this is the formula:
Return on Capital Employed = Earnings Before Interest and Tax (EBIT) ÷ (Total Assets - Current Liabilities)
0.45 = US$856m ÷ (US$3.0b - US$1.1b) (Based on the trailing twelve months to March 2024).
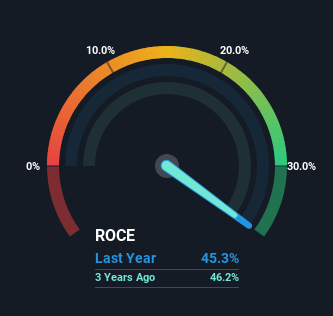
So, Lennox International has an ROCE of 45%. That's a fantastic return and not only that, it outpaces the average of 17% earned by companies in a similar industry.
View our latest analysis for Lennox International
In the above chart we have measured Lennox International's prior ROCE against its prior performance, but the future is arguably more important. If you'd like, you can check out the forecasts from the analysts covering Lennox International for free.
What Can We Tell From Lennox International's ROCE Trend?
Lennox International deserves to be commended in regards to it's returns. Over the past five years, ROCE has remained relatively flat at around 45% and the business has deployed 59% more capital into its operations. Now considering ROCE is an attractive 45%, this combination is actually pretty appealing because it means the business can consistently put money to work and generate these high returns. If these trends can continue, it wouldn't surprise us if the company became a multi-bagger.
The Key Takeaway
In the end, the company has proven it can reinvest it's capital at high rates of returns, which you'll remember is a trait of a multi-bagger. And since the stock has risen strongly over the last five years, it appears the market might expect this trend to continue. So while the positive underlying trends may be accounted for by investors, we still think this stock is worth looking into further.
One more thing to note, we've identified 1 warning sign with Lennox International and understanding it should be part of your investment process.
High returns are a key ingredient to strong performance, so check out our free list ofstocks earning high returns on equity with solid balance sheets.
Have feedback on this article? Concerned about the content? Get in touch with us directly. Alternatively, email editorial-team (at) simplywallst.com.
This article by Simply Wall St is general in nature. We provide commentary based on historical data and analyst forecasts only using an unbiased methodology and our articles are not intended to be financial advice. It does not constitute a recommendation to buy or sell any stock, and does not take account of your objectives, or your financial situation. We aim to bring you long-term focused analysis driven by fundamental data. Note that our analysis may not factor in the latest price-sensitive company announcements or qualitative material. Simply Wall St has no position in any stocks mentioned.
