
 Yahoo Finance
 Should You Care About Pennon Group Plc’s (LON:PNN) Investment Potential?

Today we'll evaluate Pennon Group Plc (LON:PNN) to determine whether it could have potential as an investment idea. To be precise, we'll consider its Return On Capital Employed (ROCE), as that will inform our view of the quality of the business.
Firstly, we'll go over how we calculate ROCE. Next, we'll compare it to others in its industry. Finally, we'll look at how its current liabilities affect its ROCE.
Understanding Return On Capital Employed (ROCE)
ROCE measures the 'return' (pre-tax profit) a company generates from capital employed in its business. In general, businesses with a higher ROCE are usually better quality. In brief, it is a useful tool, but it is not without drawbacks. Renowned investment researcher Michael Mauboussin has suggested that a high ROCE can indicate that 'one dollar invested in the company generates value of more than one dollar'.
So, How Do We Calculate ROCE?
The formula for calculating the return on capital employed is:
Return on Capital Employed = Earnings Before Interest and Tax (EBIT) ÷ (Total Assets - Current Liabilities)
Or for Pennon Group:
0.058 = UK£343m ÷ (UK£6.5b - UK£511m) (Based on the trailing twelve months to March 2019.)
Therefore, Pennon Group has an ROCE of 5.8%.
Check out our latest analysis for Pennon Group
Does Pennon Group Have A Good ROCE?
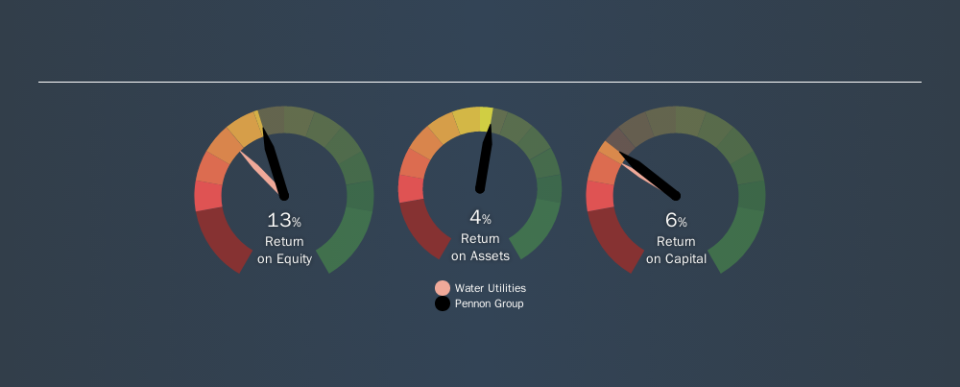
One way to assess ROCE is to compare similar companies. Using our data, Pennon Group's ROCE appears to be around the 5.8% average of the Water Utilities industry. Setting aside the industry comparison for now, Pennon Group's ROCE is mediocre in absolute terms, considering the risk of investing in stocks versus the safety of a bank account. Investors may wish to consider higher-performing investments.
You can see in the image below how Pennon Group's ROCE compares to its industry. Click to see more on past growth.
It is important to remember that ROCE shows past performance, and is not necessarily predictive. ROCE can be deceptive for cyclical businesses, as returns can look incredible in boom times, and terribly low in downturns. ROCE is, after all, simply a snap shot of a single year. Future performance is what matters, and you can see analyst predictions in our free report on analyst forecasts for the company.
What Are Current Liabilities, And How Do They Affect Pennon Group's ROCE?
Liabilities, such as supplier bills and bank overdrafts, are referred to as current liabilities if they need to be paid within 12 months. The ROCE equation subtracts current liabilities from capital employed, so a company with a lot of current liabilities appears to have less capital employed, and a higher ROCE than otherwise. To check the impact of this, we calculate if a company has high current liabilities relative to its total assets.
Pennon Group has total assets of UK£6.5b and current liabilities of UK£511m. As a result, its current liabilities are equal to approximately 7.9% of its total assets. Pennon Group reports few current liabilities, which have a negligible impact on its unremarkable ROCE.
What We Can Learn From Pennon Group's ROCE
Based on this information, Pennon Group appears to be a mediocre business. You might be able to find a better investment than Pennon Group. If you want a selection of possible winners, check out this free list of interesting companies that trade on a P/E below 20 (but have proven they can grow earnings).
If you like to buy stocks alongside management, then you might just love this free list of companies. (Hint: insiders have been buying them).
If you spot an error that warrants correction, please contact the editor at editorial-team@simplywallst.com. This article by Simply Wall St is general in nature. It does not constitute a recommendation to buy or sell any stock, and does not take account of your objectives, or your financial situation. Simply Wall St has no position in the stocks mentioned.
We aim to bring you long-term focused research analysis driven by fundamental data. Note that our analysis may not factor in the latest price-sensitive company announcements or qualitative material. Thank you for reading.
