
 Yahoo Finance
 Is CareTech Holdings PLC (LON:CTH) Creating Value For Shareholders?

Today we are going to look at CareTech Holdings PLC (LON:CTH) to see whether it might be an attractive investment prospect. Specifically, we'll consider its Return On Capital Employed (ROCE), since that will give us an insight into how efficiently the business can generate profits from the capital it requires.
First, we'll go over how we calculate ROCE. Next, we'll compare it to others in its industry. Finally, we'll look at how its current liabilities affect its ROCE.
What is Return On Capital Employed (ROCE)?
ROCE is a metric for evaluating how much pre-tax income (in percentage terms) a company earns on the capital invested in its business. All else being equal, a better business will have a higher ROCE. Overall, it is a valuable metric that has its flaws. Renowned investment researcher Michael Mauboussin has suggested that a high ROCE can indicate that 'one dollar invested in the company generates value of more than one dollar'.
How Do You Calculate Return On Capital Employed?
Analysts use this formula to calculate return on capital employed:
Return on Capital Employed = Earnings Before Interest and Tax (EBIT) ÷ (Total Assets - Current Liabilities)
Or for CareTech Holdings:
0.086 = UK£65m ÷ (UK£853m - UK£103m) (Based on the trailing twelve months to September 2019.)
Therefore, CareTech Holdings has an ROCE of 8.6%.
Check out our latest analysis for CareTech Holdings
Does CareTech Holdings Have A Good ROCE?
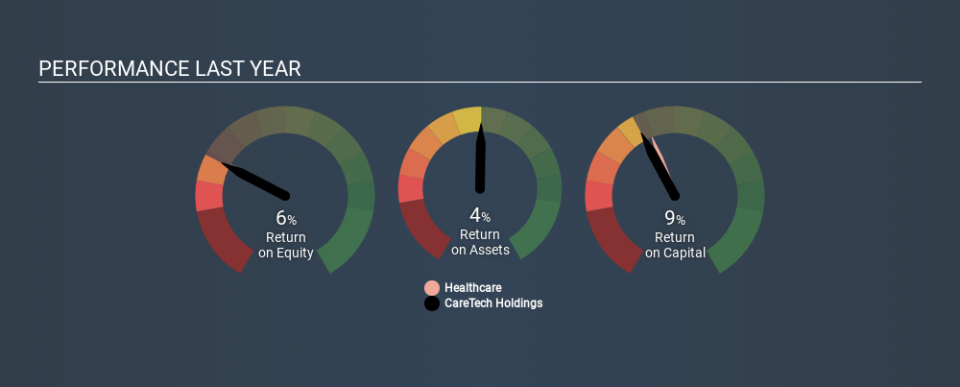
ROCE is commonly used for comparing the performance of similar businesses. We can see CareTech Holdings's ROCE is around the 10% average reported by the Healthcare industry. Separate from CareTech Holdings's performance relative to its industry, its ROCE in absolute terms looks satisfactory, and it may be worth researching in more depth.
You can see in the image below how CareTech Holdings's ROCE compares to its industry. Click to see more on past growth.
When considering this metric, keep in mind that it is backwards looking, and not necessarily predictive. Companies in cyclical industries can be difficult to understand using ROCE, as returns typically look high during boom times, and low during busts. ROCE is, after all, simply a snap shot of a single year. What happens in the future is pretty important for investors, so we have prepared a free report on analyst forecasts for CareTech Holdings.
How CareTech Holdings's Current Liabilities Impact Its ROCE
Current liabilities include invoices, such as supplier payments, short-term debt, or a tax bill, that need to be paid within 12 months. Due to the way the ROCE equation works, having large bills due in the near term can make it look as though a company has less capital employed, and thus a higher ROCE than usual. To counteract this, we check if a company has high current liabilities, relative to its total assets.
CareTech Holdings has total assets of UK£853m and current liabilities of UK£103m. As a result, its current liabilities are equal to approximately 12% of its total assets. Low current liabilities are not boosting the ROCE too much.
What We Can Learn From CareTech Holdings's ROCE
This is good to see, and with a sound ROCE, CareTech Holdings could be worth a closer look. CareTech Holdings looks strong on this analysis, but there are plenty of other companies that could be a good opportunity . Here is a free list of companies growing earnings rapidly.
If you are like me, then you will not want to miss this free list of growing companies that insiders are buying.
If you spot an error that warrants correction, please contact the editor at editorial-team@simplywallst.com. This article by Simply Wall St is general in nature. It does not constitute a recommendation to buy or sell any stock, and does not take account of your objectives, or your financial situation. Simply Wall St has no position in the stocks mentioned.
We aim to bring you long-term focused research analysis driven by fundamental data. Note that our analysis may not factor in the latest price-sensitive company announcements or qualitative material. Thank you for reading.
