
 Yahoo Finance
 Is Carlsberg (CPH:CARL B) Using Too Much Debt?

Warren Buffett famously said, 'Volatility is far from synonymous with risk.' When we think about how risky a company is, we always like to look at its use of debt, since debt overload can lead to ruin. We note that Carlsberg A/S (CPH:CARL B) does have debt on its balance sheet. But the more important question is: how much risk is that debt creating?
What Risk Does Debt Bring?
Debt and other liabilities become risky for a business when it cannot easily fulfill those obligations, either with free cash flow or by raising capital at an attractive price. In the worst case scenario, a company can go bankrupt if it cannot pay its creditors. However, a more usual (but still expensive) situation is where a company must dilute shareholders at a cheap share price simply to get debt under control. Of course, debt can be an important tool in businesses, particularly capital heavy businesses. When we think about a company's use of debt, we first look at cash and debt together.
View our latest analysis for Carlsberg
How Much Debt Does Carlsberg Carry?
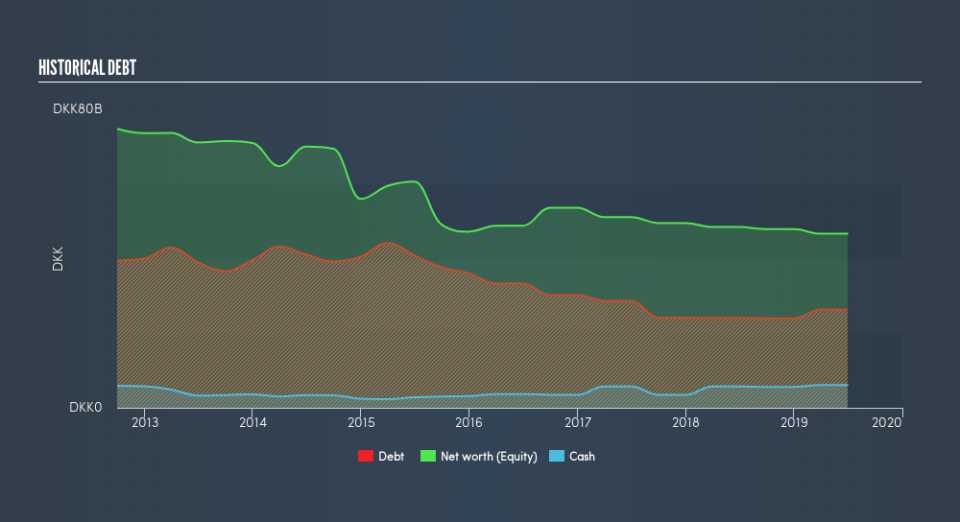
As you can see below, at the end of June 2019, Carlsberg had ø26.3b of debt, up from ø24.1b a year ago. Click the image for more detail. However, it also had ø6.13b in cash, and so its net debt is ø20.2b.
A Look At Carlsberg's Liabilities
Zooming in on the latest balance sheet data, we can see that Carlsberg had liabilities of ø39.7b due within 12 months and liabilities of ø39.0b due beyond that. Offsetting these obligations, it had cash of ø6.13b as well as receivables valued at ø10.2b due within 12 months. So it has liabilities totalling ø62.4b more than its cash and near-term receivables, combined.
This deficit isn't so bad because Carlsberg is worth a massive ø148.8b, and thus could probably raise enough capital to shore up its balance sheet, if the need arose. However, it is still worthwhile taking a close look at its ability to pay off debt.
In order to size up a company's debt relative to its earnings, we calculate its net debt divided by its earnings before interest, tax, depreciation, and amortization (EBITDA) and its earnings before interest and tax (EBIT) divided by its interest expense (its interest cover). This way, we consider both the absolute quantum of the debt, as well as the interest rates paid on it.
Carlsberg's net debt is only 1.4 times its EBITDA. And its EBIT easily covers its interest expense, being 20.7 times the size. So you could argue it is no more threatened by its debt than an elephant is by a mouse. One way Carlsberg could vanquish its debt would be if it stops borrowing more but conitinues to grow EBIT at around 14%, as it did over the last year. When analysing debt levels, the balance sheet is the obvious place to start. But ultimately the future profitability of the business will decide if Carlsberg can strengthen its balance sheet over time. So if you're focused on the future you can check out this free report showing analyst profit forecasts.
But our final consideration is also important, because a company cannot pay debt with paper profits; it needs cold hard cash. So we clearly need to look at whether that EBIT is leading to corresponding free cash flow. Over the most recent three years, Carlsberg recorded free cash flow worth 80% of its EBIT, which is around normal, given free cash flow excludes interest and tax. This cold hard cash means it can reduce its debt when it wants to.
Our View
The good news is that Carlsberg's demonstrated ability to cover its interest expense with its EBIT delights us like a fluffy puppy does a toddler. And the good news does not stop there, as its conversion of EBIT to free cash flow also supports that impression! When we consider the range of factors above, it looks like Carlsberg is pretty sensible with its use of debt. That means they are taking on a bit more risk, in the hope of boosting shareholder returns. Above most other metrics, we think its important to track how fast earnings per share is growing, if at all. If you've also come to that realization, you're in luck, because today you can view this interactive graph of Carlsberg's earnings per share history for free.
If you're interested in investing in businesses that can grow profits without the burden of debt, then check out this free list of growing businesses that have net cash on the balance sheet.
We aim to bring you long-term focused research analysis driven by fundamental data. Note that our analysis may not factor in the latest price-sensitive company announcements or qualitative material.
If you spot an error that warrants correction, please contact the editor at editorial-team@simplywallst.com. This article by Simply Wall St is general in nature. It does not constitute a recommendation to buy or sell any stock, and does not take account of your objectives, or your financial situation. Simply Wall St has no position in the stocks mentioned. Thank you for reading.
