
 Yahoo Finance
 The Case For RELX PLC (LON:REL): Could It Be A Nice Addition To Your Dividend Portfolio?

Dividend paying stocks like RELX PLC (LON:REL) tend to be popular with investors, and for good reason - some research suggests a significant amount of all stock market returns come from reinvested dividends. Unfortunately, it's common for investors to be enticed in by the seemingly attractive yield, and lose money when the company has to cut its dividend payments.
A 2.1% yield is nothing to get excited about, but investors probably think the long payment history suggests RELX has some staying power. The company also bought back stock equivalent to around 1.5% of market capitalisation this year. Some simple research can reduce the risk of buying RELX for its dividend - read on to learn more.
Explore this interactive chart for our latest analysis on RELX!
Payout ratios
Dividends are typically paid from company earnings. If a company pays more in dividends than it earned, then the dividend might become unsustainable - hardly an ideal situation. Comparing dividend payments to a company's net profit after tax is a simple way of reality-checking whether a dividend is sustainable. In the last year, RELX paid out 56% of its profit as dividends. A payout ratio above 50% generally implies a business is reaching maturity, although it is still possible to reinvest in the business or increase the dividend over time.
We also measure dividends paid against a company's levered free cash flow, to see if enough cash was generated to cover the dividend. RELX's cash payout ratio in the last year was 49%, which suggests dividends were well covered by cash generated by the business. It's positive to see that RELX's dividend is covered by both profits and cash flow, since this is generally a sign that the dividend is sustainable, and a lower payout ratio usually suggests a greater margin of safety before the dividend gets cut.
Is RELX's Balance Sheet Risky?
As RELX has a meaningful amount of debt, we need to check its balance sheet to see if the company might have debt risks. A rough way to check this is with these two simple ratios: a) net debt divided by EBITDA (earnings before interest, tax, depreciation and amortisation), and b) net interest cover. Net debt to EBITDA measures total debt load relative to company earnings (lower = less debt), while net interest cover measures the ability to pay interest on the debt (higher = greater ability to pay interest costs). With net debt of 2.72 times its EBITDA, RELX has a noticeable amount of debt, although if business stays steady, this may not be overly concerning.
We calculated its interest cover by measuring its earnings before interest and tax (EBIT), and dividing this by the company's net interest expense. Net interest cover of 10.35 times its interest expense appears reasonable for RELX, although we're conscious that even high interest cover doesn't make a company bulletproof.
We update our data on RELX every 24 hours, so you can always get our latest analysis of its financial health, here.
Dividend Volatility
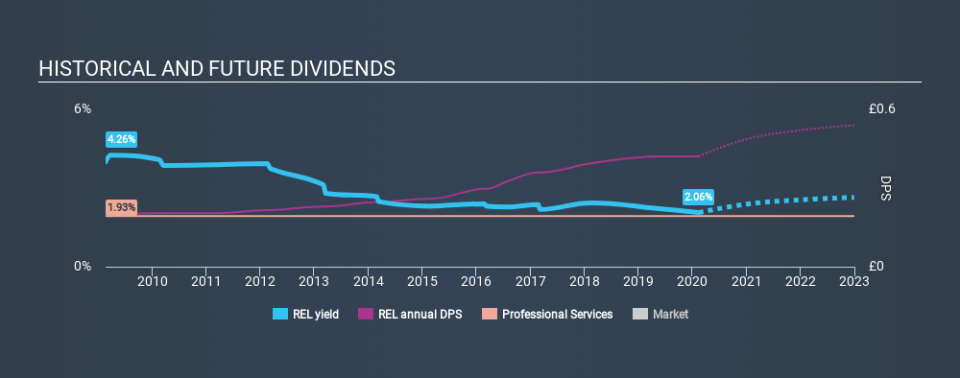
From the perspective of an income investor who wants to earn dividends for many years, there is not much point buying a stock if its dividend is regularly cut or is not reliable. RELX has been paying dividends for a long time, but for the purpose of this analysis, we only examine the past 10 years of payments. The dividend has been stable over the past 10 years, which is great. We think this could suggest some resilience to the business and its dividends. During the past ten-year period, the first annual payment was UK£0.20 in 2010, compared to UK£0.42 last year. This works out to be a compound annual growth rate (CAGR) of approximately 7.6% a year over that time.
Companies like this, growing their dividend at a decent rate, can be very valuable over the long term, if the rate of growth can be maintained.
Dividend Growth Potential
Dividend payments have been consistent over the past few years, but we should always check if earnings per share (EPS) are growing, as this will help maintain the purchasing power of the dividend. RELX has grown its earnings per share at 9.1% per annum over the past five years. Earnings per share are growing at an acceptable rate, although the company is paying out more than half of its profits, which we think could constrain its ability to reinvest in its business.
Conclusion
Dividend investors should always want to know if a) a company's dividends are affordable, b) if there is a track record of consistent payments, and c) if the dividend is capable of growing. RELX's payout ratios are within a normal range for the average corporation, and we like that its cashflow was stronger than reported profits. Next, growing earnings per share and steady dividend payments is a great combination. RELX performs highly under this analysis, although it falls slightly short of our exacting standards. At the right valuation, it could be a solid dividend prospect.
Earnings growth generally bodes well for the future value of company dividend payments. See if the 17 RELX analysts we track are forecasting continued growth with our free report on analyst estimates for the company.
We have also put together a list of global stocks with a market capitalisation above $1bn and yielding more 3%.
If you spot an error that warrants correction, please contact the editor at editorial-team@simplywallst.com. This article by Simply Wall St is general in nature. It does not constitute a recommendation to buy or sell any stock, and does not take account of your objectives, or your financial situation. Simply Wall St has no position in the stocks mentioned.
We aim to bring you long-term focused research analysis driven by fundamental data. Note that our analysis may not factor in the latest price-sensitive company announcements or qualitative material. Thank you for reading.
