
 Yahoo Finance
 Cautious Investors Not Rewarding Q2 Holdings, Inc.'s (NYSE:QTWO) Performance Completely
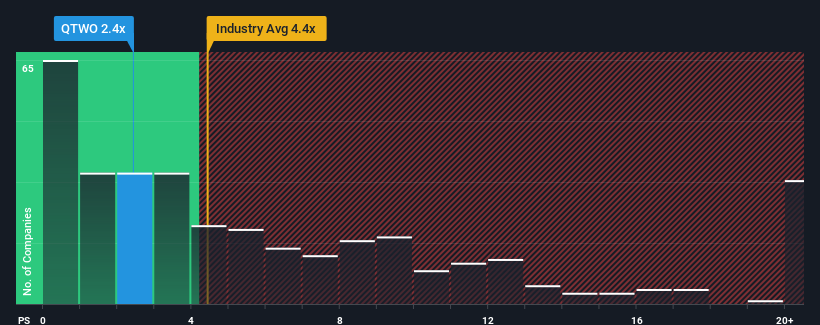
With a price-to-sales (or "P/S") ratio of 2.4x Q2 Holdings, Inc. (NYSE:QTWO) may be sending bullish signals at the moment, given that almost half of all the Software companies in the United States have P/S ratios greater than 4.4x and even P/S higher than 10x are not unusual. Although, it's not wise to just take the P/S at face value as there may be an explanation why it's limited.
View our latest analysis for Q2 Holdings
How Has Q2 Holdings Performed Recently?
Recent times haven't been great for Q2 Holdings as its revenue has been rising slower than most other companies. It seems that many are expecting the uninspiring revenue performance to persist, which has repressed the growth of the P/S ratio. If this is the case, then existing shareholders will probably struggle to get excited about the future direction of the share price.
If you'd like to see what analysts are forecasting going forward, you should check out our free report on Q2 Holdings.
Is There Any Revenue Growth Forecasted For Q2 Holdings?
There's an inherent assumption that a company should underperform the industry for P/S ratios like Q2 Holdings' to be considered reasonable.
Taking a look back first, we see that the company managed to grow revenues by a handy 13% last year. Pleasingly, revenue has also lifted 79% in aggregate from three years ago, partly thanks to the last 12 months of growth. Therefore, it's fair to say the revenue growth recently has been superb for the company.
Shifting to the future, estimates from the analysts covering the company suggest revenue should grow by 14% each year over the next three years. With the industry predicted to deliver 13% growth per year, the company is positioned for a comparable revenue result.
In light of this, it's peculiar that Q2 Holdings' P/S sits below the majority of other companies. Apparently some shareholders are doubtful of the forecasts and have been accepting lower selling prices.
What We Can Learn From Q2 Holdings' P/S?
We'd say the price-to-sales ratio's power isn't primarily as a valuation instrument but rather to gauge current investor sentiment and future expectations.
It looks to us like the P/S figures for Q2 Holdings remain low despite growth that is expected to be in line with other companies in the industry. The low P/S could be an indication that the revenue growth estimates are being questioned by the market. Perhaps investors are concerned that the company could underperform against the forecasts over the near term.
We don't want to rain on the parade too much, but we did also find 2 warning signs for Q2 Holdings that you need to be mindful of.
It's important to make sure you look for a great company, not just the first idea you come across. So if growing profitability aligns with your idea of a great company, take a peek at this free list of interesting companies with strong recent earnings growth (and a low P/E).
Have feedback on this article? Concerned about the content? Get in touch with us directly. Alternatively, email editorial-team (at) simplywallst.com.
This article by Simply Wall St is general in nature. We provide commentary based on historical data and analyst forecasts only using an unbiased methodology and our articles are not intended to be financial advice. It does not constitute a recommendation to buy or sell any stock, and does not take account of your objectives, or your financial situation. We aim to bring you long-term focused analysis driven by fundamental data. Note that our analysis may not factor in the latest price-sensitive company announcements or qualitative material. Simply Wall St has no position in any stocks mentioned.
Join A Paid User Research Session
You’ll receive a US$30 Amazon Gift card for 1 hour of your time while helping us build better investing tools for the individual investors like yourself. Sign up here
