
 Yahoo Finance
 CEIBA Investments (LON:CBA) investors are sitting on a loss of 63% if they invested five years ago
Statistically speaking, long term investing is a profitable endeavour. But along the way some stocks are going to perform badly. For example, after five long years the CEIBA Investments Limited (LON:CBA) share price is a whole 65% lower. That's an unpleasant experience for long term holders.
With that in mind, it's worth seeing if the company's underlying fundamentals have been the driver of long term performance, or if there are some discrepancies.
View our latest analysis for CEIBA Investments
CEIBA Investments wasn't profitable in the last twelve months, it is unlikely we'll see a strong correlation between its share price and its earnings per share (EPS). Arguably revenue is our next best option. Generally speaking, companies without profits are expected to grow revenue every year, and at a good clip. That's because fast revenue growth can be easily extrapolated to forecast profits, often of considerable size.
You can see below how earnings and revenue have changed over time (discover the exact values by clicking on the image).
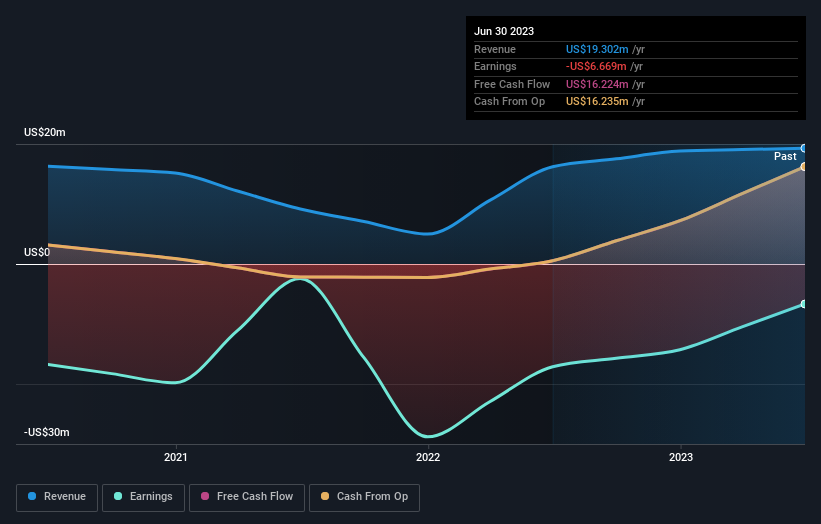
Take a more thorough look at CEIBA Investments' financial health with this free report on its balance sheet.
What About The Total Shareholder Return (TSR)?
Investors should note that there's a difference between CEIBA Investments' total shareholder return (TSR) and its share price change, which we've covered above. The TSR is a return calculation that accounts for the value of cash dividends (assuming that any dividend received was reinvested) and the calculated value of any discounted capital raisings and spin-offs. CEIBA Investments' TSR of was a loss of 63% for the 5 years. That wasn't as bad as its share price return, because it has paid dividends.
A Different Perspective
While the broader market gained around 10% in the last year, CEIBA Investments shareholders lost 18%. However, keep in mind that even the best stocks will sometimes underperform the market over a twelve month period. Regrettably, last year's performance caps off a bad run, with the shareholders facing a total loss of 10% per year over five years. Generally speaking long term share price weakness can be a bad sign, though contrarian investors might want to research the stock in hope of a turnaround. It's always interesting to track share price performance over the longer term. But to understand CEIBA Investments better, we need to consider many other factors. To that end, you should learn about the 2 warning signs we've spotted with CEIBA Investments (including 1 which shouldn't be ignored) .
Of course, you might find a fantastic investment by looking elsewhere. So take a peek at this free list of companies we expect will grow earnings.
Please note, the market returns quoted in this article reflect the market weighted average returns of stocks that currently trade on British exchanges.
Have feedback on this article? Concerned about the content? Get in touch with us directly. Alternatively, email editorial-team (at) simplywallst.com.
This article by Simply Wall St is general in nature. We provide commentary based on historical data and analyst forecasts only using an unbiased methodology and our articles are not intended to be financial advice. It does not constitute a recommendation to buy or sell any stock, and does not take account of your objectives, or your financial situation. We aim to bring you long-term focused analysis driven by fundamental data. Note that our analysis may not factor in the latest price-sensitive company announcements or qualitative material. Simply Wall St has no position in any stocks mentioned.
