
 Yahoo Finance
 Celldex Therapeutics' (NASDAQ:CLDX) investors will be pleased with their enviable 762% return over the last three years
Celldex Therapeutics, Inc. (NASDAQ:CLDX) shareholders have seen the share price descend 16% over the month. But that doesn't change the fact that the returns over the last three years have been spectacular. In fact, the share price has taken off in that time, up 762%. As long term investors the recent fall doesn't detract all that much from the longer term story. Only time will tell if there is still too much optimism currently reflected in the share price. We love happy stories like this one. The company should be really proud of that performance!
So let's assess the underlying fundamentals over the last 3 years and see if they've moved in lock-step with shareholder returns.
View our latest analysis for Celldex Therapeutics
Celldex Therapeutics isn't currently profitable, so most analysts would look to revenue growth to get an idea of how fast the underlying business is growing. When a company doesn't make profits, we'd generally expect to see good revenue growth. That's because fast revenue growth can be easily extrapolated to forecast profits, often of considerable size.
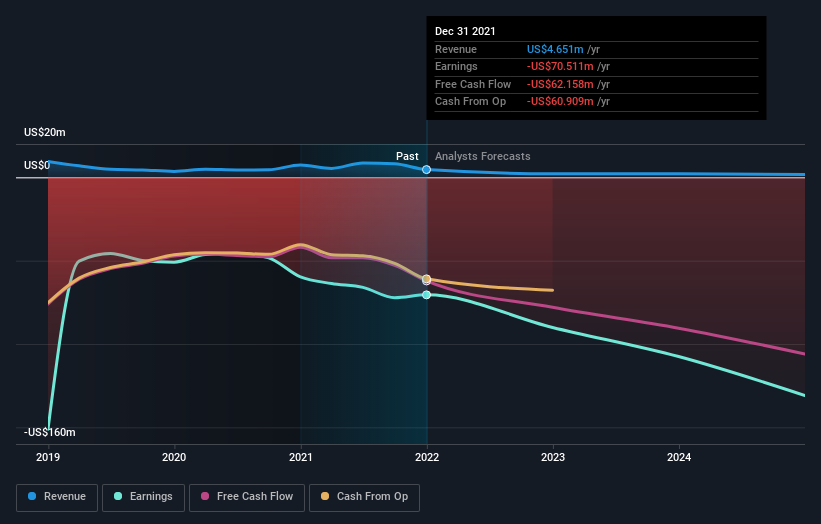
Celldex Therapeutics' revenue trended up 0.7% each year over three years. That's not a very high growth rate considering it doesn't make profits. Therefore, we're a little surprised to see the share price gain has been so strong, at 105% per year, compound, over three years. A win is a win, even if the revenue growth doesn't really explain it, in our view). The company will need to continue to execute on its business strategy to justify this rise.
You can see how earnings and revenue have changed over time in the image below (click on the chart to see the exact values).
This free interactive report on Celldex Therapeutics' balance sheet strength is a great place to start, if you want to investigate the stock further.
A Different Perspective
It's nice to see that Celldex Therapeutics shareholders have received a total shareholder return of 14% over the last year. There's no doubt those recent returns are much better than the TSR loss of 6% per year over five years. We generally put more weight on the long term performance over the short term, but the recent improvement could hint at a (positive) inflection point within the business. It's always interesting to track share price performance over the longer term. But to understand Celldex Therapeutics better, we need to consider many other factors. For instance, we've identified 4 warning signs for Celldex Therapeutics (1 makes us a bit uncomfortable) that you should be aware of.
Of course Celldex Therapeutics may not be the best stock to buy. So you may wish to see this free collection of growth stocks.
Please note, the market returns quoted in this article reflect the market weighted average returns of stocks that currently trade on US exchanges.
Have feedback on this article? Concerned about the content? Get in touch with us directly. Alternatively, email editorial-team (at) simplywallst.com.
This article by Simply Wall St is general in nature. We provide commentary based on historical data and analyst forecasts only using an unbiased methodology and our articles are not intended to be financial advice. It does not constitute a recommendation to buy or sell any stock, and does not take account of your objectives, or your financial situation. We aim to bring you long-term focused analysis driven by fundamental data. Note that our analysis may not factor in the latest price-sensitive company announcements or qualitative material. Simply Wall St has no position in any stocks mentioned.
