
 Yahoo Finance
 Should Celtic (LON:CCP) Be Disappointed With Their 52% Profit?

Generally speaking the aim of active stock picking is to find companies that provide returns that are superior to the market average. Buying under-rated businesses is one path to excess returns. For example, the Celtic plc (LON:CCP) share price is up 52% in the last 5 years, clearly besting the market decline of around 11% (ignoring dividends).
See our latest analysis for Celtic
While the efficient markets hypothesis continues to be taught by some, it has been proven that markets are over-reactive dynamic systems, and investors are not always rational. One way to examine how market sentiment has changed over time is to look at the interaction between a company's share price and its earnings per share (EPS).
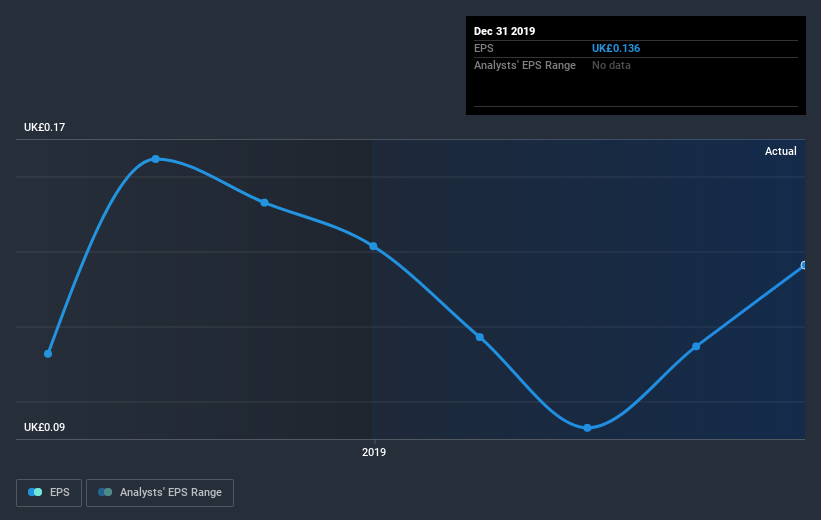
During the five years of share price growth, Celtic moved from a loss to profitability. That's generally thought to be a genuine positive, so we would expect to see an increasing share price. Since the company was unprofitable five years ago, but not three years ago, it's worth taking a look at the returns in the last three years, too. We can see that the Celtic share price is up 17% in the last three years. During the same period, EPS grew by 20% each year. This EPS growth is higher than the 5.3% average annual increase in the share price over the same three years. So you might conclude the market is a little more cautious about the stock, these days. This cautious sentiment is reflected in its (fairly low) P/E ratio of 8.43.
The company's earnings per share (over time) is depicted in the image below (click to see the exact numbers).
This free interactive report on Celtic's earnings, revenue and cash flow is a great place to start, if you want to investigate the stock further.
A Different Perspective
We regret to report that Celtic shareholders are down 30% for the year. Unfortunately, that's worse than the broader market decline of 11%. Having said that, it's inevitable that some stocks will be oversold in a falling market. The key is to keep your eyes on the fundamental developments. Longer term investors wouldn't be so upset, since they would have made 8.8%, each year, over five years. It could be that the recent sell-off is an opportunity, so it may be worth checking the fundamental data for signs of a long term growth trend. While it is well worth considering the different impacts that market conditions can have on the share price, there are other factors that are even more important. For example, we've discovered 1 warning sign for Celtic that you should be aware of before investing here.
Of course, you might find a fantastic investment by looking elsewhere. So take a peek at this free list of companies we expect will grow earnings.
Please note, the market returns quoted in this article reflect the market weighted average returns of stocks that currently trade on GB exchanges.
This article by Simply Wall St is general in nature. It does not constitute a recommendation to buy or sell any stock, and does not take account of your objectives, or your financial situation. We aim to bring you long-term focused analysis driven by fundamental data. Note that our analysis may not factor in the latest price-sensitive company announcements or qualitative material. Simply Wall St has no position in any stocks mentioned.
Have feedback on this article? Concerned about the content? Get in touch with us directly. Alternatively, email editorial-team@simplywallst.com.
