
 Yahoo Finance
 Is Celtic plc’s (LON:CCP) P/E Ratio Really That Good?

This article is for investors who would like to improve their understanding of price to earnings ratios (P/E ratios). We’ll show how you can use Celtic plc’s (LON:CCP) P/E ratio to inform your assessment of the investment opportunity. Celtic has a P/E ratio of 10.05, based on the last twelve months. That means that at current prices, buyers pay £10.05 for every £1 in trailing yearly profits.
View our latest analysis for Celtic
Want to help shape the future of investing tools? Participate in a short research study and receive a 6-month subscription to the award winning Simply Wall St research tool (valued at $60)!
How Do I Calculate A Price To Earnings Ratio?
The formula for P/E is:
Price to Earnings Ratio = Share Price ÷ Earnings per Share (EPS)
Or for Celtic:
P/E of 10.05 = £1.66 ÷ £0.16 (Based on the year to June 2018.)
Is A High Price-to-Earnings Ratio Good?
A higher P/E ratio implies that investors pay a higher price for the earning power of the business. That isn’t necessarily good or bad, but a high P/E implies relatively high expectations of what a company can achieve in the future.
How Growth Rates Impact P/E Ratios
Earnings growth rates have a big influence on P/E ratios. That’s because companies that grow earnings per share quickly will rapidly increase the ‘E’ in the equation. Therefore, even if you pay a high multiple of earnings now, that multiple will become lower in the future. Then, a lower P/E should attract more buyers, pushing the share price up.
Celtic increased earnings per share by a whopping 123% last year. And its annual EPS growth rate over 3 years is 91%. With that performance, I would expect it to have an above average P/E ratio. Unfortunately, earnings per share are down 3.3% a year, over 5 years.
How Does Celtic’s P/E Ratio Compare To Its Peers?
The P/E ratio essentially measures market expectations of a company. If you look at the image below, you can see Celtic has a lower P/E than the average (25.6) in the entertainment industry classification.
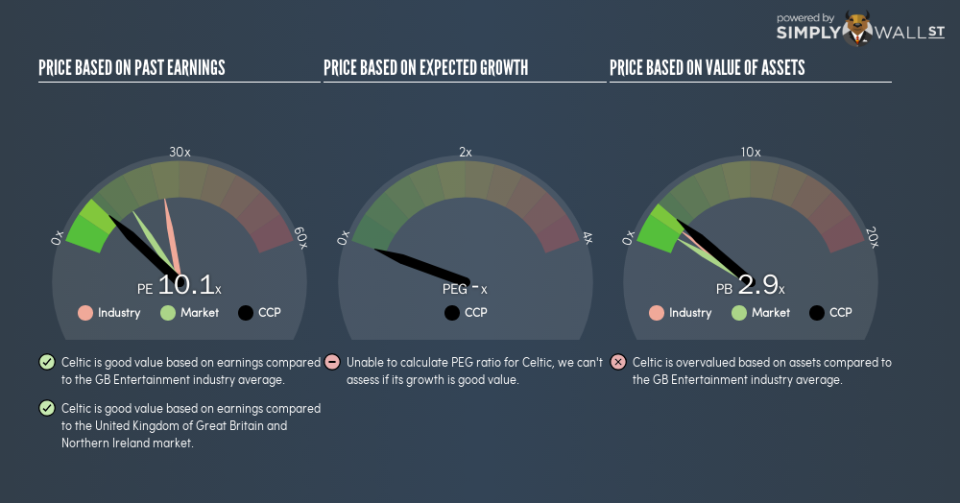
This suggests that market participants think Celtic will underperform other companies in its industry. Since the market seems unimpressed with Celtic, it’s quite possible it could surprise on the upside. You should delve deeper. I like to check if company insiders have been buying or selling.
A Limitation: P/E Ratios Ignore Debt and Cash In The Bank
Don’t forget that the P/E ratio considers market capitalization. That means it doesn’t take debt or cash into account. Theoretically, a business can improve its earnings (and produce a lower P/E in the future), by taking on debt (or spending its remaining cash).
Such spending might be good or bad, overall, but the key point here is that you need to look at debt to understand the P/E ratio in context.
Is Debt Impacting Celtic’s P/E?
Since Celtic holds net cash of UK£32m, it can spend on growth, justifying a higher P/E ratio than otherwise.
The Bottom Line On Celtic’s P/E Ratio
Celtic has a P/E of 10.1. That’s below the average in the GB market, which is 15.8. It grew its EPS nicely over the last year, and the healthy balance sheet implies there is more potential for growth. The relatively low P/E ratio implies the market is pessimistic.
Investors should be looking to buy stocks that the market is wrong about. As value investor Benjamin Graham famously said, ‘In the short run, the market is a voting machine but in the long run, it is a weighing machine.’ So this free visual report on analyst forecasts could hold they key to an excellent investment decision.
Of course, you might find a fantastic investment by looking at a few good candidates. So take a peek at this free list of companies with modest (or no) debt, trading on a P/E below 20.
To help readers see past the short term volatility of the financial market, we aim to bring you a long-term focused research analysis purely driven by fundamental data. Note that our analysis does not factor in the latest price-sensitive company announcements.
The author is an independent contributor and at the time of publication had no position in the stocks mentioned. For errors that warrant correction please contact the editor at editorial-team@simplywallst.com.
