
 Yahoo Finance
 Is Centrica plc (LON:CNA) A Sell At Its Current PE Ratio?

This article is intended for those of you who are at the beginning of your investing journey and want to better understand how you can grow your money by investing in Centrica plc (LON:CNA).
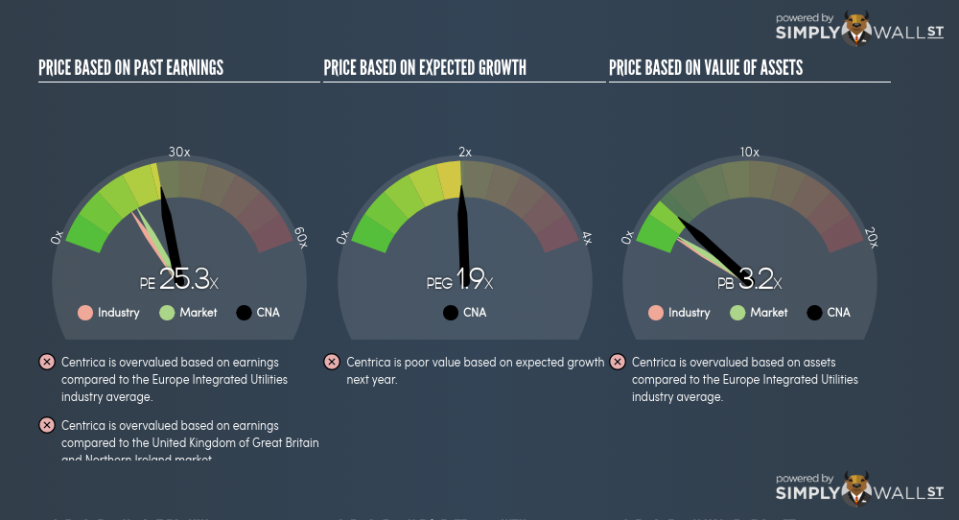
Centrica plc (LON:CNA) is currently trading at a trailing P/E of 25.3x, which is higher than the industry average of 15.1x. While CNA might seem like a stock to avoid or sell if you own it, it is important to understand the assumptions behind the P/E ratio before you make any investment decisions. Today, I will explain what the P/E ratio is as well as what you should look out for when using it. View out our latest analysis for Centrica
Demystifying the P/E ratio
P/E is often used for relative valuation since earnings power is a chief driver of investment value. By comparing a stock’s price per share to its earnings per share, we are able to see how much investors are paying for each dollar of the company’s earnings.
P/E Calculation for CNA
Price-Earnings Ratio = Price per share ÷ Earnings per share
CNA Price-Earnings Ratio = £1.52 ÷ £0.0601 = 25.3x
On its own, the P/E ratio doesn’t tell you much; however, it becomes extremely useful when you compare it with other similar companies. We preferably want to compare the stock’s P/E ratio to the average of companies that have similar features to CNA, such as capital structure and profitability. A quick method of creating a peer group is to use companies in the same industry, which is what I will do. CNA’s P/E of 25.3x is higher than its industry peers (17.3x), which implies that each dollar of CNA’s earnings is being overvalued by investors. As such, our analysis shows that CNA represents an over-priced stock.
Assumptions to watch out for
However, before you rush out to sell your CNA shares, it is important to note that this conclusion is based on two key assumptions. Firstly, our peer group contains companies that are similar to CNA. If this isn’t the case, the difference in P/E could be due to other factors. For example, if you compared lower risk firms with CNA, then investors would naturally value it at a lower price since it is a riskier investment. The second assumption that must hold true is that the stocks we are comparing CNA to are fairly valued by the market. If this does not hold true, CNA’s lower P/E ratio may be because firms in our peer group are overvalued by the market.
What this means for you:
Since you may have already conducted your due diligence on CNA, the overvaluation of the stock may mean it is a good time to reduce your current holdings. But at the end of the day, keep in mind that relative valuation relies heavily on critical assumptions I’ve outlined above. Remember that basing your investment decision off one metric alone is certainly not sufficient. There are many things I have not taken into account in this article and the PE ratio is very one-dimensional. If you have not done so already, I highly recommend you to complete your research by taking a look at the following:
Future Outlook: What are well-informed industry analysts predicting for CNA’s future growth? Take a look at our free research report of analyst consensus for CNA’s outlook.
Past Track Record: Has CNA been consistently performing well irrespective of the ups and downs in the market? Go into more detail in the past performance analysis and take a look at the free visual representations of CNA’s historicals for more clarity.
Other High-Performing Stocks: Are there other stocks that provide better prospects with proven track records? Explore our free list of these great stocks here.
To help readers see pass the short term volatility of the financial market, we aim to bring you a long-term focused research analysis purely driven by fundamental data. Note that our analysis does not factor in the latest price sensitive company announcements.
The author is an independent contributor and at the time of publication had no position in the stocks mentioned.
