
 Yahoo Finance
 CEPS (LON:CEPS) Is Looking To Continue Growing Its Returns On Capital
Did you know there are some financial metrics that can provide clues of a potential multi-bagger? Ideally, a business will show two trends; firstly a growing return on capital employed (ROCE) and secondly, an increasing amount of capital employed. If you see this, it typically means it's a company with a great business model and plenty of profitable reinvestment opportunities. So on that note, CEPS (LON:CEPS) looks quite promising in regards to its trends of return on capital.
Understanding Return On Capital Employed (ROCE)
For those that aren't sure what ROCE is, it measures the amount of pre-tax profits a company can generate from the capital employed in its business. Analysts use this formula to calculate it for CEPS:
Return on Capital Employed = Earnings Before Interest and Tax (EBIT) ÷ (Total Assets - Current Liabilities)
0.17 = UK£2.6m ÷ (UK£23m - UK£8.2m) (Based on the trailing twelve months to June 2023).
Therefore, CEPS has an ROCE of 17%. On its own, that's a standard return, however it's much better than the 6.5% generated by the Industrials industry.
View our latest analysis for CEPS
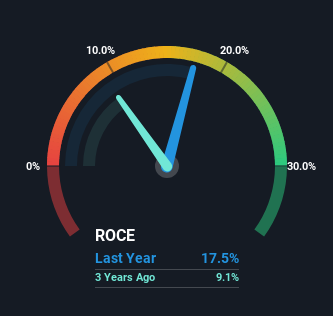
Historical performance is a great place to start when researching a stock so above you can see the gauge for CEPS' ROCE against it's prior returns. If you're interested in investigating CEPS' past further, check out this free graph of past earnings, revenue and cash flow.
What Can We Tell From CEPS' ROCE Trend?
CEPS is displaying some positive trends. The data shows that returns on capital have increased substantially over the last five years to 17%. The company is effectively making more money per dollar of capital used, and it's worth noting that the amount of capital has increased too, by 101%. So we're very much inspired by what we're seeing at CEPS thanks to its ability to profitably reinvest capital.
On a related note, the company's ratio of current liabilities to total assets has decreased to 35%, which basically reduces it's funding from the likes of short-term creditors or suppliers. Therefore we can rest assured that the growth in ROCE is a result of the business' fundamental improvements, rather than a cooking class featuring this company's books.
In Conclusion...
In summary, it's great to see that CEPS can compound returns by consistently reinvesting capital at increasing rates of return, because these are some of the key ingredients of those highly sought after multi-baggers. Investors may not be impressed by the favorable underlying trends yet because over the last five years the stock has only returned 12% to shareholders. So exploring more about this stock could uncover a good opportunity, if the valuation and other metrics stack up.
One final note, you should learn about the 2 warning signs we've spotted with CEPS (including 1 which is a bit concerning) .
For those who like to invest in solid companies, check out this free list of companies with solid balance sheets and high returns on equity.
Have feedback on this article? Concerned about the content? Get in touch with us directly. Alternatively, email editorial-team (at) simplywallst.com.
This article by Simply Wall St is general in nature. We provide commentary based on historical data and analyst forecasts only using an unbiased methodology and our articles are not intended to be financial advice. It does not constitute a recommendation to buy or sell any stock, and does not take account of your objectives, or your financial situation. We aim to bring you long-term focused analysis driven by fundamental data. Note that our analysis may not factor in the latest price-sensitive company announcements or qualitative material. Simply Wall St has no position in any stocks mentioned.
