
 Yahoo Finance
 Ceva, Inc. Announces First Quarter 2024 Financial Results
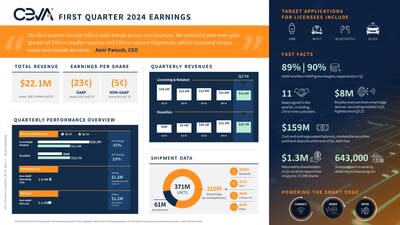
- Royalty revenue of $10.7 million, up 33% year-over-year, generated from 371 million shipped units, up 25% year-over-year
- 11 license agreements concluded in the quarter, across all key target markets, including strategic deals for next-generation Wi-Fi 7 and Bluetooth 6 IPs
ROCKVILLE, Md., May 9, 2024 /PRNewswire/ -- Ceva, Inc. (NASDAQ: CEVA), the leading licensor of silicon and software IP that enables Smart Edge devices to connect, sense and infer data more reliably and efficiently, today announced its financial results for the first quarter ended March 31, 2024. Financial results for the first quarter ended March 31, 2023, reflect Ceva's continuing operations only, with the Intrinsix business reflected as a discontinued operation, unless otherwise noted.
Operational Highlights:
Introduced new Wi-Fi 7 platform for high-end consumer and industrial IoT
Introduced new low power Ultra-Wideband (UWB) IP for consumer and industrial IoT
Expanded Ceva-NeuPro-M NPU AI ecosystem with new partnerships for automotive and edge AI
Announced strategic partnership with India's No. 1 audio and wearable brand, boAt for wireless audio
Partnered with THX to bring premium spatial audio to hearables, consumer and mobile products
Collaborated with Arm through Arm Total Design to accelerate development of end-to-end 5G SoCs for Infrastructure and NTN Satellites
Total revenue for the first quarter of 2024 was $22.1 million, compared to $26.3 million reported for the first quarter of 2023. Licensing and related revenue for the first quarter of 2024 was $11.4 million, compared to $18.2 million reported for the same quarter a year ago. Royalty revenue for the first quarter of 2024 was $10.7 million, compared to $8.0 million reported for the first quarter of 2023.
Amir Panush, Chief Executive Officer of Ceva, commented: "Our first quarter results reflect solid trends across our business. We achieved year-over-year growth of 33% in royalty revenue and 25% in volume shipments, which increased across every end market we serve. Licensing revenue for the first quarter included strategic early-adopter deals with lead customers for our Bluetooth 6 and Wi-Fi 7 IPs, but overall was lower than anticipated as some deals expected to close in the first quarter were delayed. We have already concluded one of these deals early in the second quarter, a significant agreement with a strategic customer for a next-generation IP in development, and expect others to be executed in the remainder of the year. Overall, I am very encouraged by our diversified licensing pipeline and demand for our next-generation IPs, and I am confident we can reach our total revenue target for the year."
During the quarter, eleven IP licensing agreements were concluded, targeting a wide range of end markets and applications, including Bluetooth 5 connectivity for wearables and industrial IoT, Bluetooth 6 for wireless audio, Wi-Fi 6, Wi-Fi 7 and UWB for smart edge consumer devices, 5G RedCap for consumer and industrial devices, 5G V2X modems for automotive, and audio for smartphones. Two of the deals signed were with first-time customers.
GAAP gross margin for the first quarter of 2024 was 89%, as compared to 87% in the first quarter of 2023. GAAP operating loss for the first quarter of 2024 was $5.0 million, as compared to a GAAP operating loss of $2.6 million for the same period in 2023. GAAP net loss for the first quarter of 2024 was $5.4 million, as compared to a GAAP net loss of $2.7 million reported for the same period in 2023. GAAP diluted loss per share for the first quarter of 2024 was $0.23, as compared to GAAP diluted loss per share of $0.12 for the same period in 2023.
GAAP net loss with the discontinued operation for the first quarter of 2023 was $4.9 million. GAAP diluted loss per share with the discontinued operation for the first quarter of 2023 was $0.21.
Non-GAAP gross margin for the first quarter of 2024 was 90%, as compared to 88% for the same period in 2023. Non-GAAP operating loss for the first quarter of 2024 was $0.8 million, as compared to non-GAAP operating income of $1.2 million reported for the first quarter of 2023. Non-GAAP net loss and diluted loss per share for the first quarter of 2024 were $1.3 million and $0.05, respectively, compared with non-GAAP net income and diluted income per share of $1.2 million and $0.05, respectively, reported for the first quarter of 2023.
Non-GAAP net income including the discontinued operation for the first quarter of 2023 was $0.1 million. Non-GAAP diluted income per share including the discontinued operation for the first quarter of 2023 was $0.00.
Yaniv Arieli, Chief Financial Officer of Ceva, stated: "While we saw a shortfall in licensing revenue in the first quarter, we have managed to build a healthy backlog which will benefit us in the second quarter. We continue to monitor our expenses closely and look for ways to further improve our operating efficiency. At the end of the quarter, our cash and cash equivalent balances, marketable securities and bank deposits were approximately $159 million, and we remain well positioned to pursue opportunities to enhance our product offerings, expand our addressable markets and accelerate our growth."
Ceva Conference Call
On May 9, 2024, Ceva management will conduct a conference call at 8:30 a.m. Eastern Time to discuss the operating performance for the quarter.
The conference call will be available via the following dial in numbers:
U.S. Participants : Dial 1-844-435-0316 (Access Code : Ceva)
International Participants: Dial +1-412-317-6365 (Access Code: Ceva)
The conference call will also be available live via webcast at the following link: https://app.webinar.net/L8QP0XRjm5A. Please go to the web site at least fifteen minutes prior to the call to register.
For those who cannot access the live broadcast, a replay will be available by dialing +1-877-344-7529 or +1-412-317-0088 (access code: 9691632) from one hour after the end of the call until 9:00 a.m. (Eastern Time) on May 16, 2024. The replay will also be available at Ceva's web site www.ceva-ip.com.
Forward Looking Statements
This press release contains forward-looking statements that involve risks and uncertainties, as well as assumptions that if they materialize or prove incorrect, could cause the results of Ceva to differ materially from those expressed or implied by such forward-looking statements and assumptions. Forward-looking statements include statements regarding the benefits of Ceva's deal backlog for the second quarter and potential execution of license deals later in the year, Ceva's ability to reach total revenue target for the remainder of the year, and Ceva's positioning to pursue opportunities to enhance our product offerings, expand our addressable markets and accelerate our growth. The risks, uncertainties and assumptions that could cause differing Ceva results include: the effect of intense industry competition; the ability of Ceva's technologies and products incorporating Ceva's technologies to achieve market acceptance; Ceva's ability to meet changing needs of end-users and evolving market demands; the cyclical nature of and general economic conditions in the semiconductor industry; Ceva's ability to diversify its royalty streams and license revenues; Ceva's ability to continue to generate significant revenues from the handset baseband market and to penetrate new markets; instability and disruptions related to the ongoing Israel-Gaza conflict; and general market conditions and other risks relating to Ceva's business, including, but not limited to, those that are described from time to time in our SEC filings. Ceva assumes no obligation to update any forward-looking statements or information, which speak as of their respective dates.
Non-GAAP Financial Measures
Non-GAAP gross margin for the first quarter of 2024 excluded: (a) equity-based compensation expenses of $0.2 million and (b) amortization of acquired intangibles of $0.1 million. Non-GAAP gross margin for the first quarter of 2023 excluded: (a) equity-based compensation expenses of $0.2 million and (b) amortization of acquired intangibles of $0.1 million.
Non-GAAP operating loss for the first quarter of 2024 excluded: (a) equity-based compensation expenses of $3.6 million, (b) the impact of the amortization of acquired intangibles of $0.3 million, and (c) $0.3 million of costs associated with business acquisitions. Non-GAAP operating income for the first quarter of 2023 excluded: (a) equity-based compensation expenses of $3.6 million and (b) the impact of the amortization of acquired intangibles of $0.2 million.
Non-GAAP net loss and diluted loss per share for the first quarter of 2024 excluded: (a) equity-based compensation expenses of $3.6 million, (b) the impact of the amortization of acquired intangibles of $0.3 million, (c) $0.3 million of costs associated with business acquisitions and (d) $0.1 million loss associated with the remeasurement of marketable equity securities. Non-GAAP net income and diluted earnings per share for the first quarter of 2023 excluded: (a) equity-based compensation expenses of $3.6 million, (b) the impact of the amortization of acquired intangibles of $0.2 million, and (c) $0.1 million loss associated with the remeasurement of marketable equity securities.
Non-GAAP net loss including the discontinued operation and diluted earnings per share including the discontinued operation for the first quarter of 2023 excluded: (a) equity-based compensation expenses of $3.6 million, (b) the impact of the amortization of acquired intangibles of $0.2 million, (c) $0.1 million loss associated with the remeasurement of marketable equity securities and (d) $1.1 million loss associated with discontinued operations.
About Ceva, Inc.
At Ceva, we are passionate about bringing new levels of innovation to the smart edge. Our wireless communications, sensing and Edge AI technologies are at the heart of some of today's most advanced smart edge products. From Bluetooth connectivity, Wi-Fi, UWB and 5G platform IP for ubiquitous, robust communications, to scalable Edge AI NPU IPs, sensor fusion processors and embedded application software that make devices smarter, we have the broadest portfolio of IP to connect, sense and infer data more reliably and efficiently. We deliver differentiated solutions that combine outstanding performance at ultra-low power within a very small silicon footprint. Our goal is simple – to deliver the silicon and software IP to enable a smarter, safer, and more interconnected world. This philosophy is in practice today, with Ceva powering more than 17 billion of the world's most innovative smart edge products from AI-infused smartwatches, IoT devices and wearables to autonomous vehicles and 5G mobile networks.
Our headquarters are in Rockville, Maryland with a global customer base supported by operations worldwide. Our employees are among the leading experts in their areas of specialty, consistently solving the most complex design challenges, enabling our customers to bring innovative smart edge products to market.
Ceva is a sustainability- and environmentally-conscious company, adhering to our Code of Business Conduct and Ethics. As such, we emphasize and focus on environmental preservation, recycling, the welfare of our employees and privacy – which we promote on a corporate level. At Ceva, we are committed to social responsibility, values of preservation and consciousness towards these purposes.
Ceva: Powering the Smart Edge™
Visit us at www.ceva-ip.com and follow us on LinkedIn, X, YouTube, Facebook, and Instagram.
Ceva, Inc. AND ITS SUBSIDIARIES INTERIM CONDENSED CONSOLIDATED STATEMENTS OF LOSS – U.S. GAAP U.S. dollars in thousands, except per share data | ||
Three months ended | ||
March 31, | ||
2024 | 2023 | |
Unaudited | Unaudited | |
Revenues: | ||
Licensing and related revenues | $ 11,414 | $ 18,248 |
Royalties | 10,658 | 8,014 |
Total revenues | 22,072 | 26,262 |
Cost of revenues | 2,503 | 3,508 |
Gross profit | 19,569 | 22,754 |
Operating expenses: | ||
Research and development, net | 17,991 | 18,674 |
Sales and marketing | 2,816 | 2,719 |
General and administrative | 3,572 | 3,827 |
Amortization of intangible assets | 150 | 154 |
Total operating expenses | 24,529 | 25,374 |
Operating loss | (4,960) | (2,620) |
Financial income, net | 1,257 | 1,455 |
Remeasurement of marketable equity securities | (60) | (117) |
Loss before taxes on income | (3,763) | (1,282) |
Taxes on Income | 1,685 | 1,417 |
Net loss from continuing operation | (5,448) | (2,699) |
Discontinued operation
| - | (2,173) |
Net loss | $ (5,448) | $ )4,872) |
Basic and diluted net loss per share: | ||
Continuing operation | (0.23) | (0.12) |
Discontinued operation | - | (0.09) |
Basic and diluted net loss per share | $ (0.23) | $ (0.21) |
Weighted-average shares used to compute net loss per share (in thousands): | ||
Basic | 23,508 | 23,334 |
Diluted | 23,508 | 23,334 |
Unaudited Reconciliation of GAAP to Non-GAAP Financial Measures U.S. Dollars in thousands, except per share amounts | ||
Three months ended | ||
March 31, | ||
2024 | 2023 | |
Unaudited | Unaudited | |
GAAP net loss | $ (5,448) | $ (4,872) |
Equity-based compensation expense included in cost of revenues | 203 | 206 |
Equity-based compensation expense included in research and development expenses | 2,007 | 2,102 |
Equity-based compensation expense included in sales and marketing expenses | 365 | 378 |
Equity-based compensation expense included in general and administrative expenses | 996 | 866 |
Amortization of intangible assets | 278 | 224 |
Costs associated with business acquisition | 280 | - |
loss associated with the remeasurement of marketable equity securities. | 60 | 117 |
Non-GAAP from discontinued operation | - | 1,086 |
Non-GAAP net income (loss) | $ (1,259) | $ 107 |
GAAP weighted-average number of Common Stock used in computation of diluted net loss and loss per share (in thousands) | 23,508 | 23,334 |
Weighted-average number of shares related to outstanding stock-based awards (in thousands) | - | 1,021 |
Weighted-average number of Common Stock used in computation of diluted net income (loss) per share, excluding the above (in thousands) | 23,508 | 24,355 |
GAAP diluted loss per share | $ (0.23) | $ (0.21) |
Equity-based compensation expense | $ 0.15 | $ 0.15 |
Amortization of intangible assets | $ 0.01 | $ 0.01 |
Costs associated with business acquisition | $ 0.01 | - |
Income associated with the remeasurement of marketable equity securities. | $ 0.01 | $ 0.01 |
Non-GAAP from discontinued operation | - | $ 0.04 |
Non-GAAP diluted income (loss) per share | $ (0.05) | $ 0.00 |
Three months ended | ||
March 31, | ||
2024 | 2023 | |
Unaudited | Unaudited | |
GAAP Operating loss | $ (4,960) | $ (2,620) |
Equity-based compensation expense included in cost of revenues | 203 | 206 |
Equity-based compensation expense included in research and development expenses | 2,007 | 2,102 |
Equity-based compensation expense included in sales and marketing expenses | 365 | 378 |
Equity-based compensation expense included in general and administrative expenses | 996 | 866 |
Amortization of intangible assets | 278 | 224 |
Costs associated with business acquisition | 280 | - |
Total non-GAAP Operating Income (loss) | $ (831) | $ 1,156 |
Three months ended | ||
March 31, | ||
2024 | 2023 | |
Unaudited | Unaudited | |
GAAP Gross Profit | $ 19,569 | $ 22,754 |
GAAP Gross Margin | 89 % | 87 % |
Equity-based compensation expense included in cost of revenues | 203 | 206 |
Amortization of intangible assets | 128 | 70 |
Total Non-GAAP Gross profit | 19,900 | 23,030 |
Non-GAAP Gross Margin | 90 % | 88 % |
Ceva, Inc. AND ITS SUBSIDIARIES INTERIM CONDENSED CONSOLIDATED BALANCE SHEETS (U.S. Dollars in thousands) | ||||||
March 31, | December 31, | |||||
2024 | 2023 (*) | |||||
Unaudited | Unaudited | |||||
ASSETS | ||||||
Current assets: | ||||||
Cash and cash equivalents | $ 21,222 | $ 23,287 | ||||
Marketable securities and short-term bank deposits | 137,532 | 143,251 | ||||
Trade receivables, net | 14,052 | 8,433 | ||||
Unbilled receivables | 19,583 | 21,874 | ||||
Prepaid expenses and other current assets | 13,378 | 12,526 | ||||
Total current assets | 205,767 | 209,371 | ||||
Long-term assets: | ||||||
Severance pay fund | 6,897 | 7,070 | ||||
Deferred tax assets, net | 1,239 | 1,609 | ||||
Property and equipment, net | 7,157 | 6,732 | ||||
Operating lease right-of-use assets | 6,704 | 6,978 | ||||
Investment in marketable equity securities | 346 | 406 | ||||
Goodwill | 58,308 | 58,308 | ||||
Intangible assets, net | 2,689 | 2,967 | ||||
Other long-term assets | 12,332 | 10,644 | ||||
Total assets | $ 301,439 | $ 304,085 | ||||
LIABILITIES AND STOCKHOLDERS' EQUITY | ||||||
Current liabilities: | ||||||
Trade payables | $ 1,804 | $ 1,154 | ||||
Deferred revenues | 2,479 | 3,018 | ||||
Accrued expenses and other payables | 19,838 | 20,202 | ||||
Operating lease liabilities | 2,634 | 2,513 | ||||
Total current liabilities | 26,755 | 26,887 | ||||
Long-term liabilities: | ||||||
Accrued severance pay | 7,339 | 7,524 | ||||
Operating lease liabilities | 3,525 | 3,943 | ||||
Other accrued liabilities | 1,471 | 1,390 | ||||
Total liabilities | 39,090 | 39,744 | ||||
Stockholders' equity: | ||||||
Common stock | 24 | 23 | ||||
Additional paid in-capital | 252,927 | 252,100 | ||||
Treasury stock | (2,528) | (5,620) | ||||
Accumulated other comprehensive loss | (2,720) | (2,329) | ||||
Retained earnings | 14,646 | 20,167 | ||||
Total stockholders' equity | 262,349 | 264,341 | ||||
Total liabilities and stockholders' equity | $ 301,439 | $ 304,085 | ||||
(*) Derived from audited financial statements. | ||||||


View original content to download multimedia:https://www.prnewswire.com/news-releases/ceva-inc-announces-first-quarter-2024-financial-results-302140426.html
SOURCE Ceva, Inc.
